Our client needed a reliable foundation to support market analyses, forecasts, and decision-making in the construction and property sectors. Computools developed MetricPillar – a centralized analytics framework that standardizes data processing, calculations, filtering logic, and visualization rules across a growing ecosystem of analytical applications.
MetricPillar became a shared analytical backbone for the client’s products, improving consistency, reducing manual data handling, and strengthening confidence in insights used by more than 1,000 end users.
The client is a leading provider of construction and property market intelligence in Northern Europe, delivering market analyses, forecasts, and decision-support insights for thousands of industry professionals. Their services help businesses understand market drivers, industry dynamics, customer behavior, and purchasing patterns across the Nordic construction and property sectors.
The client operates a broad ecosystem of analytical applications designed to transform complex market data into clear, actionable insights. As the number of applications grew, ensuring consistent data processing, accurate visualizations, and reliable analytical outputs across the entire product portfolio became a critical challenge. Before MetricPillar, visual inconsistencies and fragmented calculation logic created operational friction and affected overall product stability.
The client worked with large volumes of unstructured and semi-structured construction market data from end customers, primarily in Excel and CSV formats. While the data contained valuable information about market trends and drivers, its fragmented structure made analysis complex, time-consuming, and prone to inconsistencies.
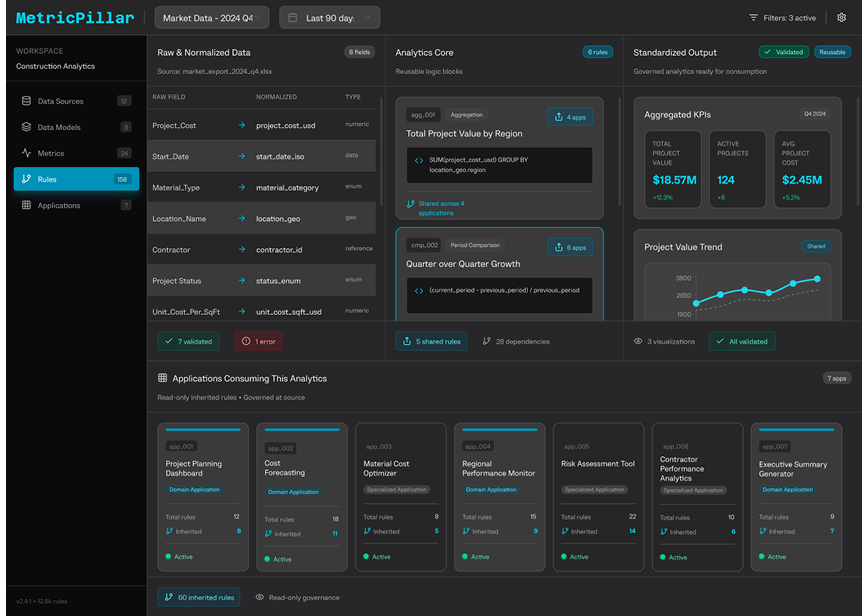
As the number of analytical applications increased, each product implemented its own logic for data transformation, filtering, aggregation, and visualization. Core analytical operations: aggregations, deltas, period comparisons, sorting, and filtering were done manually or reimplemented separately in each application.
This led to several challenges:
Because the client’s products underpin decision-making for construction and property businesses, any analytical inconsistency directly affects market interpretation, forecasts, and strategic decisions.
Computools developed MetricPillar, a centralized analytics framework designed to bring structure, consistency, and reuse to construction market data across all analytical applications.
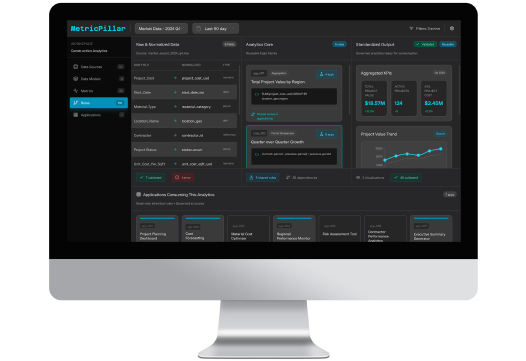
MetricPillar standardizes how client-provided data is processed, transformed, and visualized. Instead of duplicating analytical logic across products, the framework provides a shared foundation for calculations, filtering, aggregations, and visualization behaviour used throughout the ecosystem.
The framework supports two application categories:
MetricPillar centralizes key analytical capabilities, including:
By introducing a shared analytics core, the client eliminated manual data processing and configuration inconsistencies, providing a scalable foundation for market analysis, forecasting, and decision support across their entire product portfolio.
MetricPillar delivered measurable architectural and operational improvements:
MetricPillar became a foundational layer for scaling market intelligence apps across Norway, Sweden, Denmark, Finland, Spain, the Czech Republic, and Slovakia.
The client chose Computools for our experience in building large-scale analytical platforms and ensuring data consistency across complex application ecosystems. Our team demonstrated the ability to stabilize analytical logic, improve visualization reliability, and support long-term platform evolution as business needs and markets expanded.
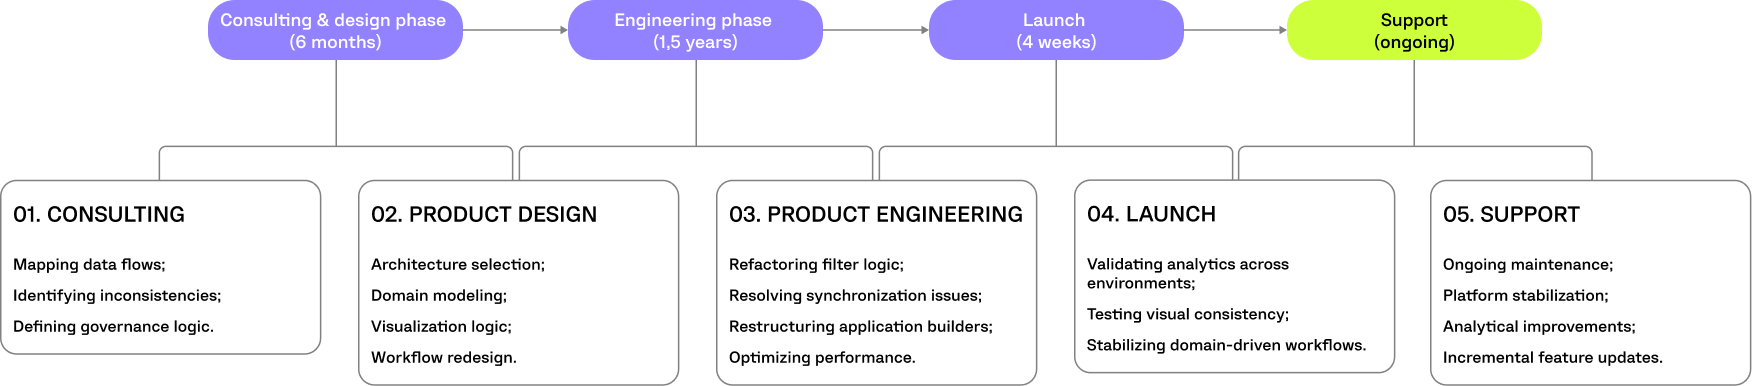
MetricPillar was designed around a scalable analytical architecture. The process started with defining the core user persona and mapping how analysts configure data, filters, and visual logic across applications.
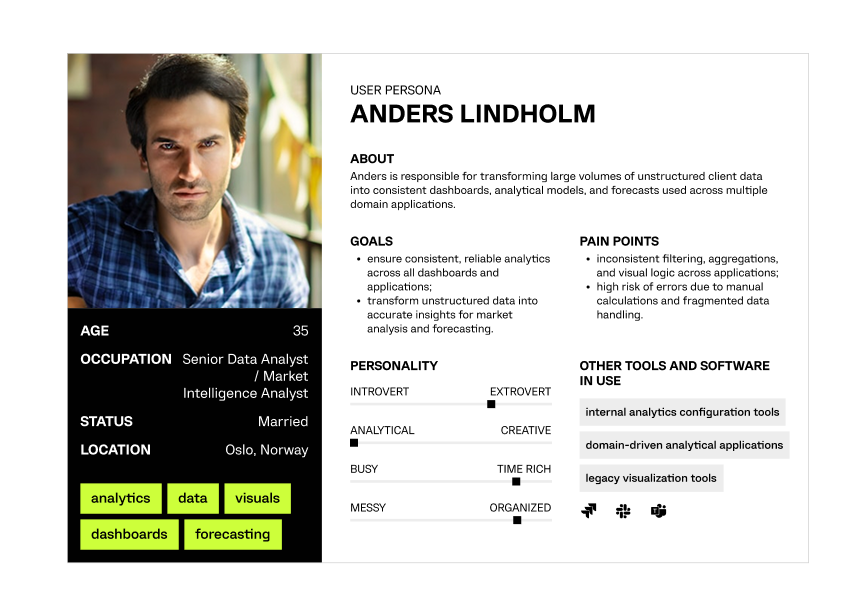
Creating a clear profile of data analysts and product stakeholders responsible for configuring analytics, validating data, and using dashboards to support market analysis and decision-making.
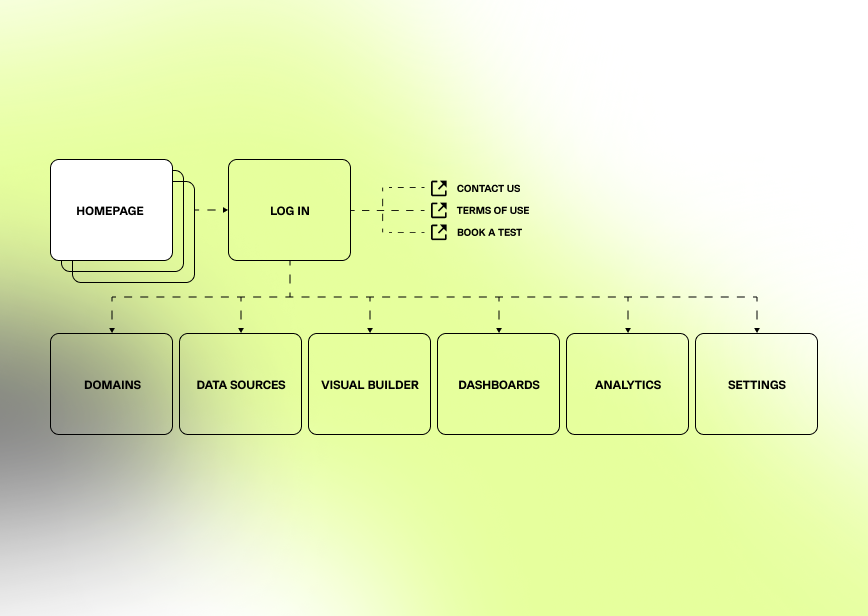
Outlining the structured flow connecting configuration tools, analytical settings, dashboards, and domain-driven applications.

Outlining early screen structures to ensure clear data workflows, intuitive visualization setup, and seamless cross-application interactions.
Building a clear and structured interface that simplifies complex configuration tasks and supports accurate, reliable analytics across all applications.

.NET APPLICATION CORE (.NET, C#, ASP.NET Core Web API, Layered Architecture)
The core of the MetricPillar platform is built on .NET and follows a layered architecture. It is responsible for managing configuration logic, filter interactions, core business workflows, and overall application behavior. The Application Core coordinates interactions between the presentation layer and underlying data and infrastructure layers, ensuring clear separation of concerns and predictable system behavior. This structure supports scalability and maintainability as new domains, features, and applications are introduced.

VISUALIZE CORE (Blazor Server, Mudblazor)
The Visualize Core is responsible for rendering and orchestrating the entire user interface of the MetricPillar platform. Built with Blazor Server and MudBlazor, it delivers a consistent, responsive, and component-driven UI across dashboards, filters, and visualizations. This layer ensures real-time UI updates, unified design standards, and seamless user interaction with underlying domain logic and data insights.

VISUALIZATION ENGINE (AmCharts, Tabulator, Leaflet)
The platform supports: metrics, tables, maps, and different types of charts: bar/column, time, pie, dumbbell, treemap, gauge, word cloud for data transformation platforms that support aggregations, deltas, pivoted columns, blends, geospatial polygons, WMS layers, and other advanced visual elements, ensuring backward compatibility and stable rendering.

DATA PIPELINE (Azure Data Explorer / Kusto)
Kusto is the primary source for analytical data and visualizations. It powers fast querying of charts, metrics, maps, ranges, time-based analyses, and other domain-specific insights across all applications. Kusto provides read-only access to protect data from modification.

CONFIGURATION STORAGE (Azure CosmosDB)
CosmosDB is used to store and edit configuration metadata in the visualization admin panel. It ensures the stable, consistent behavior of visuals, filters, and domain-driven applications across the ecosystem.

AI & LANGUAGE SERVICES (Azure Cognitive Services)
AI capabilities include chatbot assistance and automated glossary translation across Scandinavian languages. These functions are powered by Azure Cognitive Services and seamlessly integrated into the broader analytics system.
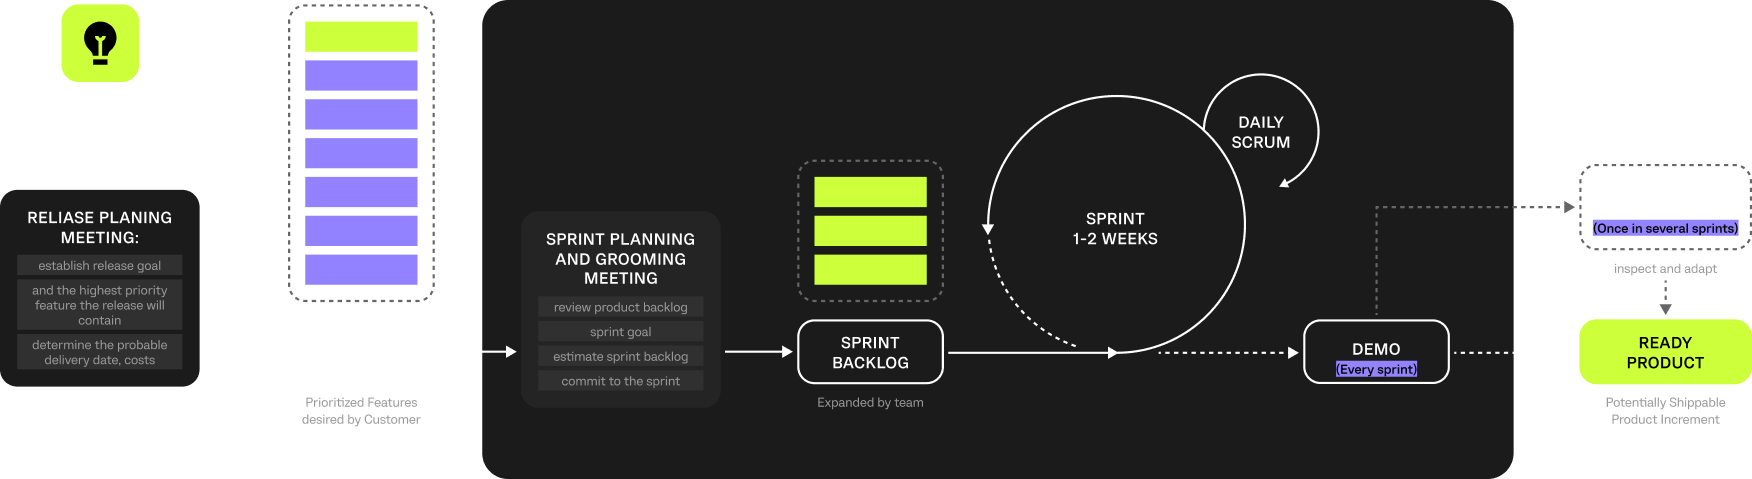
The project followed a Scrum-based approach, ensuring transparency, flexibility, and continuous iteration. The Computools team worked closely with the client through regular planning and review sessions, adapting requirements based on real usage and analytical needs.
Quality assurance focused on analytical accuracy, visualization consistency, and cross-environment stability.
The core team included two .NET engineers, a Project Manager, and sales support, collaborating via Jira, Slack, and Microsoft Teams.
We have had the pleasure to work with Computools for several projects, from AI to front-end and backend web solutions. We are very happy with the professional handling and the engaged developers. We will highly recommend their expertise.

Computools | 341 Raven Cir, Camden Wyoming, Delaware 19934, US


