THE AUTHOR:

To keep pace with the evolution of energy management, businesses choose to build a predictive analytics energy software platform. Energy infrastructure teams need to balance operating cost control and equipment risk management while fulfilling corporate decarbonization initiatives and managing distributed energy resources.
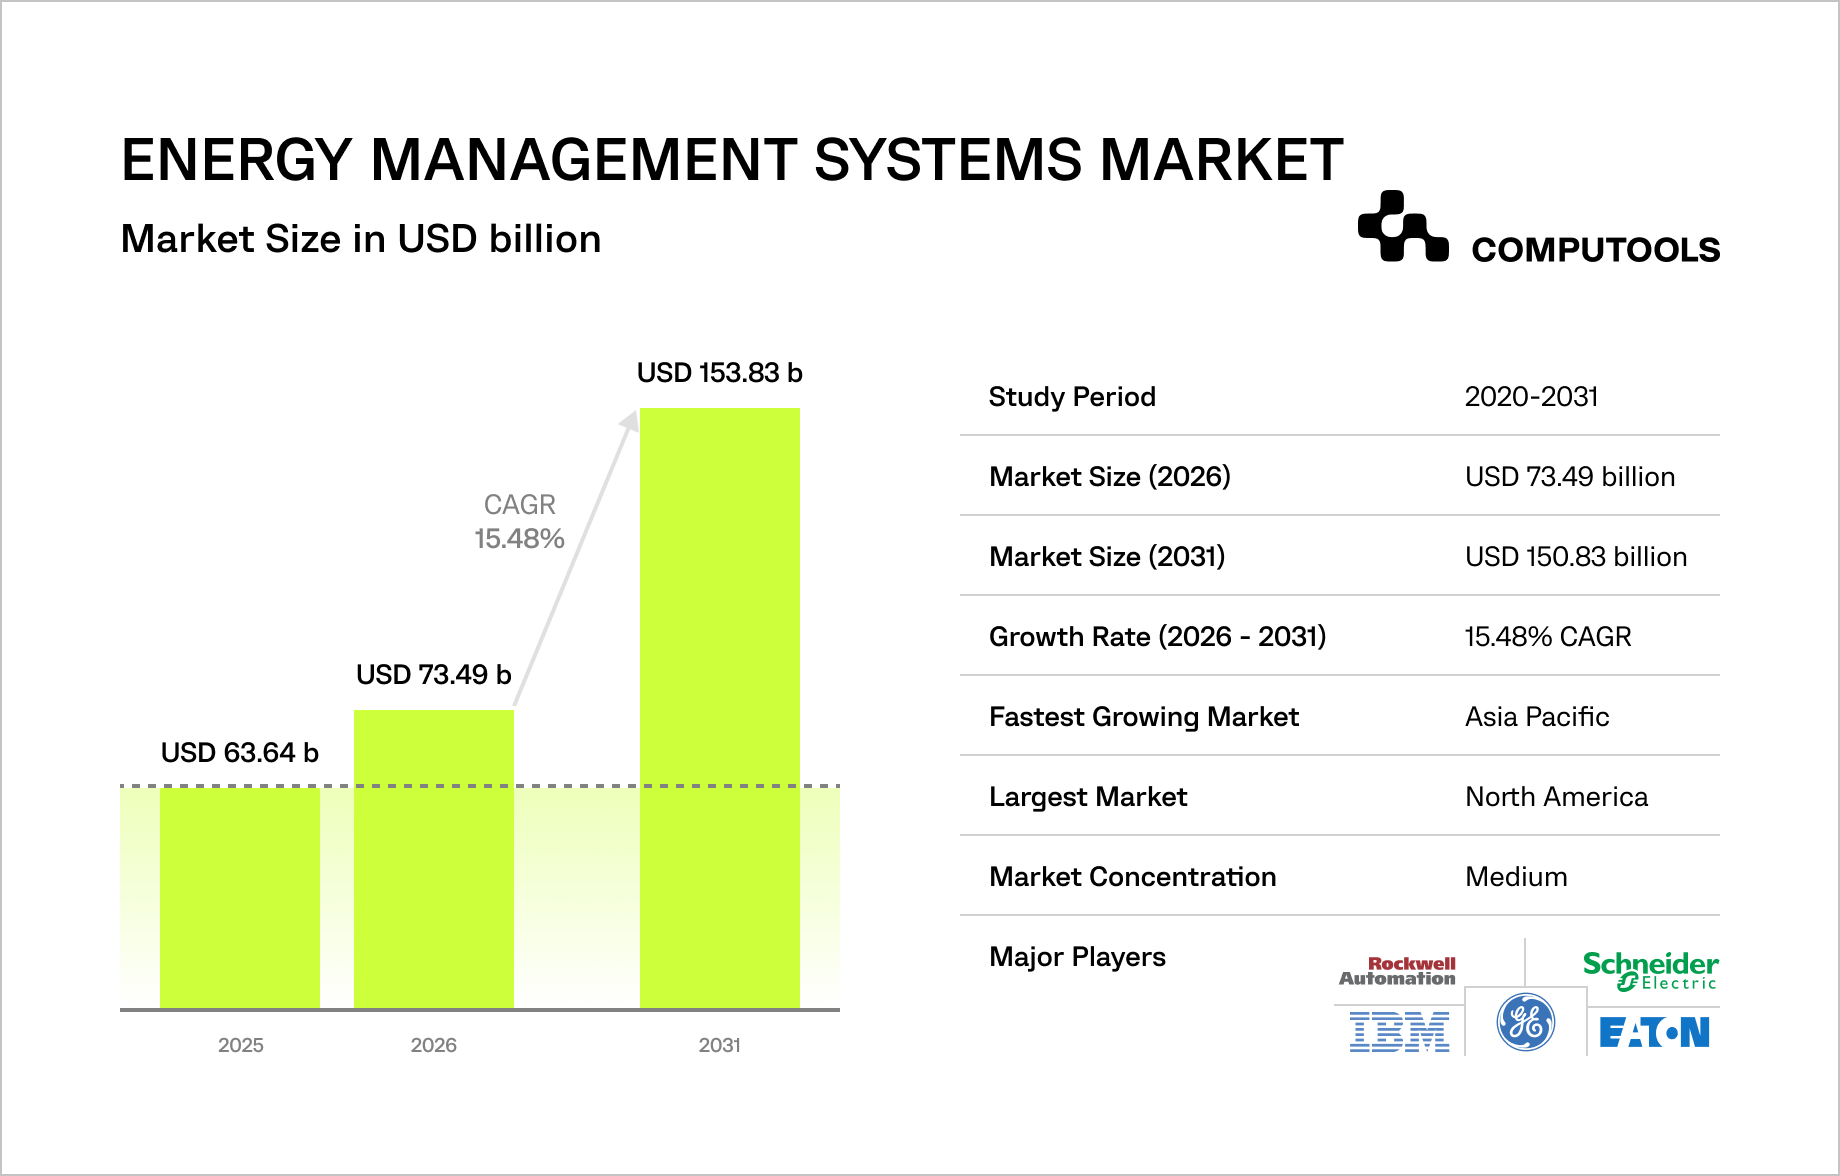
Mordor Intelligence estimates the market for energy management systems was USD 63.64 billion in 2025, increasing to USD 150.83 billion in 2031. This growth indicates an increasing corporate focus on systems that can monitor, predict, and optimize energy-related decisions across various connected assets and automate those decisions through AI predictive analytics for energy.
Most of the emerging requirements are driven by operational requirements. The advancement of AMI (advanced metering infrastructure) and industrial IoT for energy will enable utilities to have much more detailed and granular data. The net-zero building code will require all commercial buildings from 2026 onward to have connected systems for HVAC, lighting, and other control systems. Corporate PPAs (power purchase agreements) will require real-time tracking, certificates, and periodic carbon reporting. AI-driven predictive maintenance will increasingly be a business driver for energy companies, as they will want to shift from scheduled intervals to maintenance activities based on the condition of the equipment.
This alters the requirements for energy software. A platform can’t just be a dashboard that passively displays yesterday’s consumption or a report of the current static assets. With predictive analytics, energy software must collect data in real-time, recognize abnormal behaviors, predict the future, detect the degradation of an asset, determine when it is most appropriate to act, and integrate the recommendations with the operational workflows.
For the utilities, manufacturers, power, health care, data center and commercial real estate operators, the value is in acting sooner to reduce emergency maintenance, optimize energy assets, diminish the time required to perform manual site reports, and improve site viewing.
Mordor Intelligence also highlights the biggest barriers to businesses as the significant upfront costs of integration, OT/IT legacy interoperability gaps, the burden of cybersecurity, and the lack of EMS personnel. For these reasons, companies require a platform strategy that must be aligned with the principles of clean data, a scalable and secure software architecture and integrations, user roles, automation logic and continuous improvement after the system has been launched.
This article explains how to develop predictive analytics energy software for modern energy infrastructure, what data and architecture decisions matter most, where AI creates practical value, and how Computools approaches these platforms as business-critical systems connected to assets, teams, revenue, compliance, and long-term scalability.
Computools case study: building predictive analytics energy software
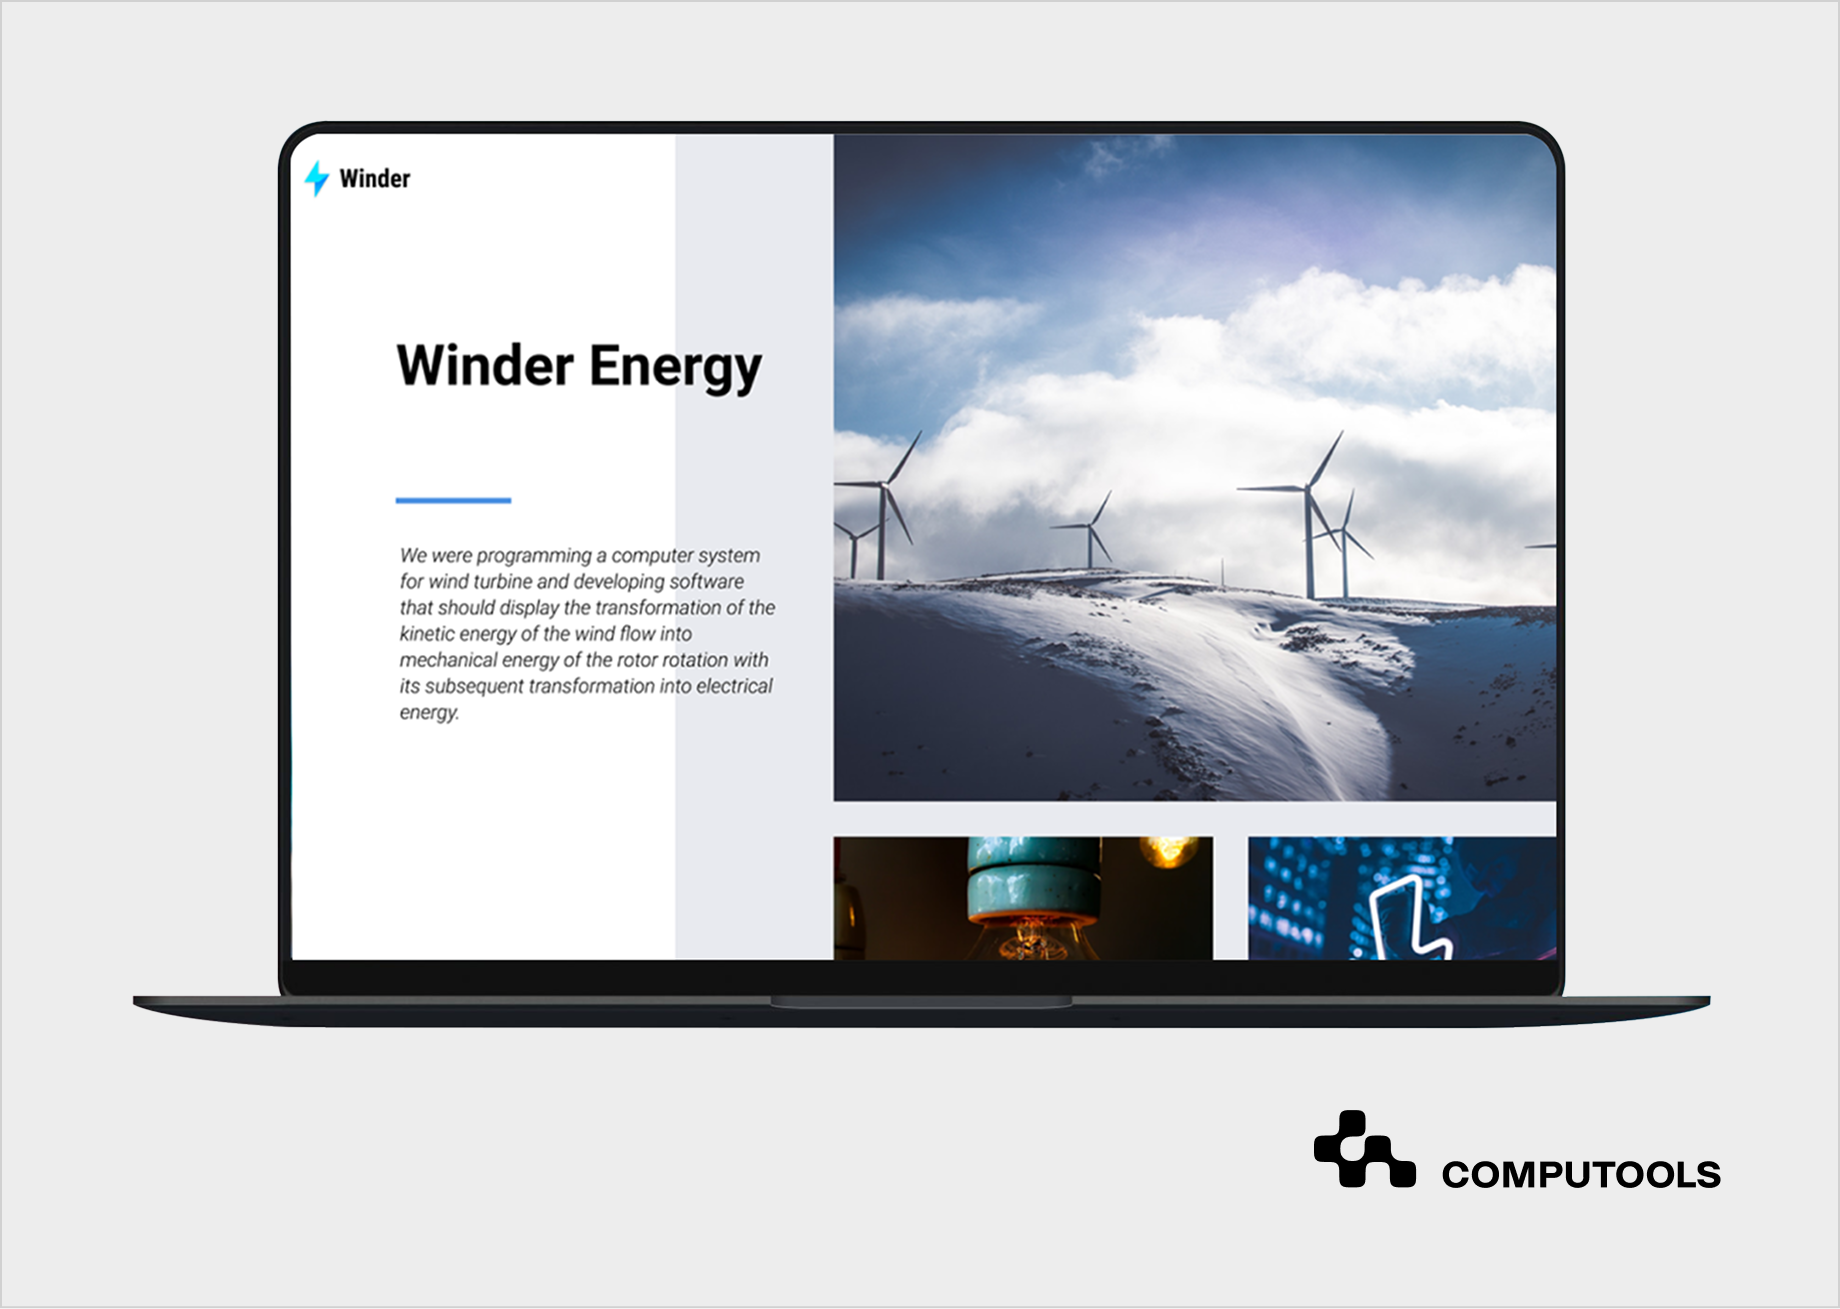
Energy infrastructure analytics becomes valuable when data from connected assets turns into faster, safer, and more accurate operational decisions. Computools applied this logic in the Winder project, where the client needed stronger control over energy devices used in critical infrastructure environments.
Client context
Winder worked with energy devices that had to be configured, monitored, and managed with high accuracy. The client needed a system that could support device placement, collect operational data, and use it to improve infrastructure planning and safety.
Business challenge
The client encountered a blend of technical and operational challenges. The data collected from devices needed to be sourced from several locations, fused, and then presented in a format that enabled rapid decision-making. Manual verification and incomplete data could reduce system responsiveness, create blind spots, and increase the difficulty of predicting risks. These would negatively impact the performance of the system infrastructure. The energy data analytics software was required to accommodate the constraints of certain operational logic. Therefore, architectural design, security, and the system’s reliability were all primary concerns.
Computools solution
Our team began by studying the device APIs, the communications design, and the data flows before constructing the platform. The developed system provided infrastructure for data collection, the application of predictive algorithms, and device and infrastructure monitoring. It also integrated back-end services, front-end interfaces, cloud technologies, and flexible data storage.
The technology stack included Java, Go, Angular, Flutter, C++, Docker, Kubernetes, PostgreSQL, and MongoDB. This stack enabled the platform to provide varied data services and maintain the ability to grow in the future. Predictive logic was added to identify potential events and support better decisions around device configuration and operational planning.
Business result
The platform delivered visibility across integrated systems and strengthened the client’s foundation for energy asset optimization. The teams can work with organized operational data rather than fragmented data. This reduced manual effort and increased planning precision. It also helped the client to manage the infrastructure in a safer and more sustainable way.
The Winder project exemplifies the foundational concept of predictive analytics energy software: AI alone does not create value. The value is realized when the solution is able to collect and process clean data, make predictions, integrate workflows, and deliver the insights to the teams before they face up to the system downtimes, safety issues and operational cost inefficiencies.
For a closer look at how real-time infrastructure visibility supports predictive analytics, read Computools’ guide on how to develop a real-time energy asset monitoring platform.
How to develop predictive analytics energy software
Developing predictive analytics energy software begins with a central question: which operational decisions should be improved through speed, accuracy and greater control? While energy companies could be interested in AI for forecasting, anomaly detection, or predictive maintenance, the better option is to identify the operational bottleneck.
1. Define the Operational Decisions the Platform Must Improve
Do not focus on the architecture or AI model design before you identify the decisions the software will help to support. So, you should first answer the following questions. When is it appropriate to perform an inspection of an asset? Which transformer requires the most urgent attention? Where are energy losses most pronounced? How is energy demand expected to change in the coming week?
The first version of the software will focus on specific assets, locations, teams, threats, and key performance indicators (KPIs) as prioritized by the business. The executives will need summaries of asset performance, as well as the risks and the potential financial impacts.
Operations teams need alerts, root-cause indicators, and task priorities. Field teams need mobile access to asset history, inspection notes, and recommended actions.
Each prediction should connect to a workflow. For example:
• overheating risk → maintenance inspection;
• abnormal consumption → fraud or fault review;
• demand spike forecast → load planning;
• asset degradation score → replacement planning;
• renewable output forecast → dispatch adjustment.
Without this step, the platform may collect large volumes of energy data without improving operations. Teams will continue to rely on spreadsheets and manual checks until the system is aligned with the way they make decisions.
An example of what a decision framework might look like includes user role, asset type, data input, prediction type, confidence level, action, trigger, rule of escalation, and a business KPI.
For energy forecasting software, the matrix may prioritize factors including historical consumption, weather, tariffs, customer segments, and calendar.
2. Build the Data Foundation for Energy Infrastructure Analytics
AI depends on clean, structured, and traceable data. In energy infrastructure analytics, data often comes from SCADA systems, IoT sensors, smart meters, AMI systems, maintenance records, inspection logs, ERP platforms, GIS tools, weather services, and market data.
The business should decide which data sources matter most for the first release. For predictive maintenance energy software, this may include asset registry data, sensor readings, work orders, fault history, and operating conditions. For energy forecasting software, the priority may be historical consumption, weather, tariffs, customer segments, and calendar patterns.
Regarding the data model, it must include users, assets, sites, meters, sensors, events, alerts, readings, thresholds, work orders, inspections, predictions, and maintenance records. It is important to keep time-series data separate from business and workflow data. This is because sensor readings, load curves, voltage, temperature, and consumption records require high-volume timestamped storage.
Data quality rules are of great importance. The system must validate readings, standardize timestamps, and automate fault detection, duplicate removal, and data lineage. Without this, energy system modeling and machine learning will yield poor-quality and unreliable predictions.
In the Winder project, Computools analyzed device APIs and communication strategies before building the operational platform. The same logic applies to AI software for energy infrastructure: the platform can only predict risk accurately when data is collected, cleaned, stored, and connected to assets correctly.
3. Design Architecture Around Real-Time Monitoring and Predictive Processing
Predictive analytics energy software should show what is happening now and what is likely to happen next. Real-time energy monitoring supports urgent events such as overheating, voltage anomalies, device failure signals, and safety alerts. Predictive processing can assess failure, forecast demand, analyze degradation of resources, and prioritize maintenance.
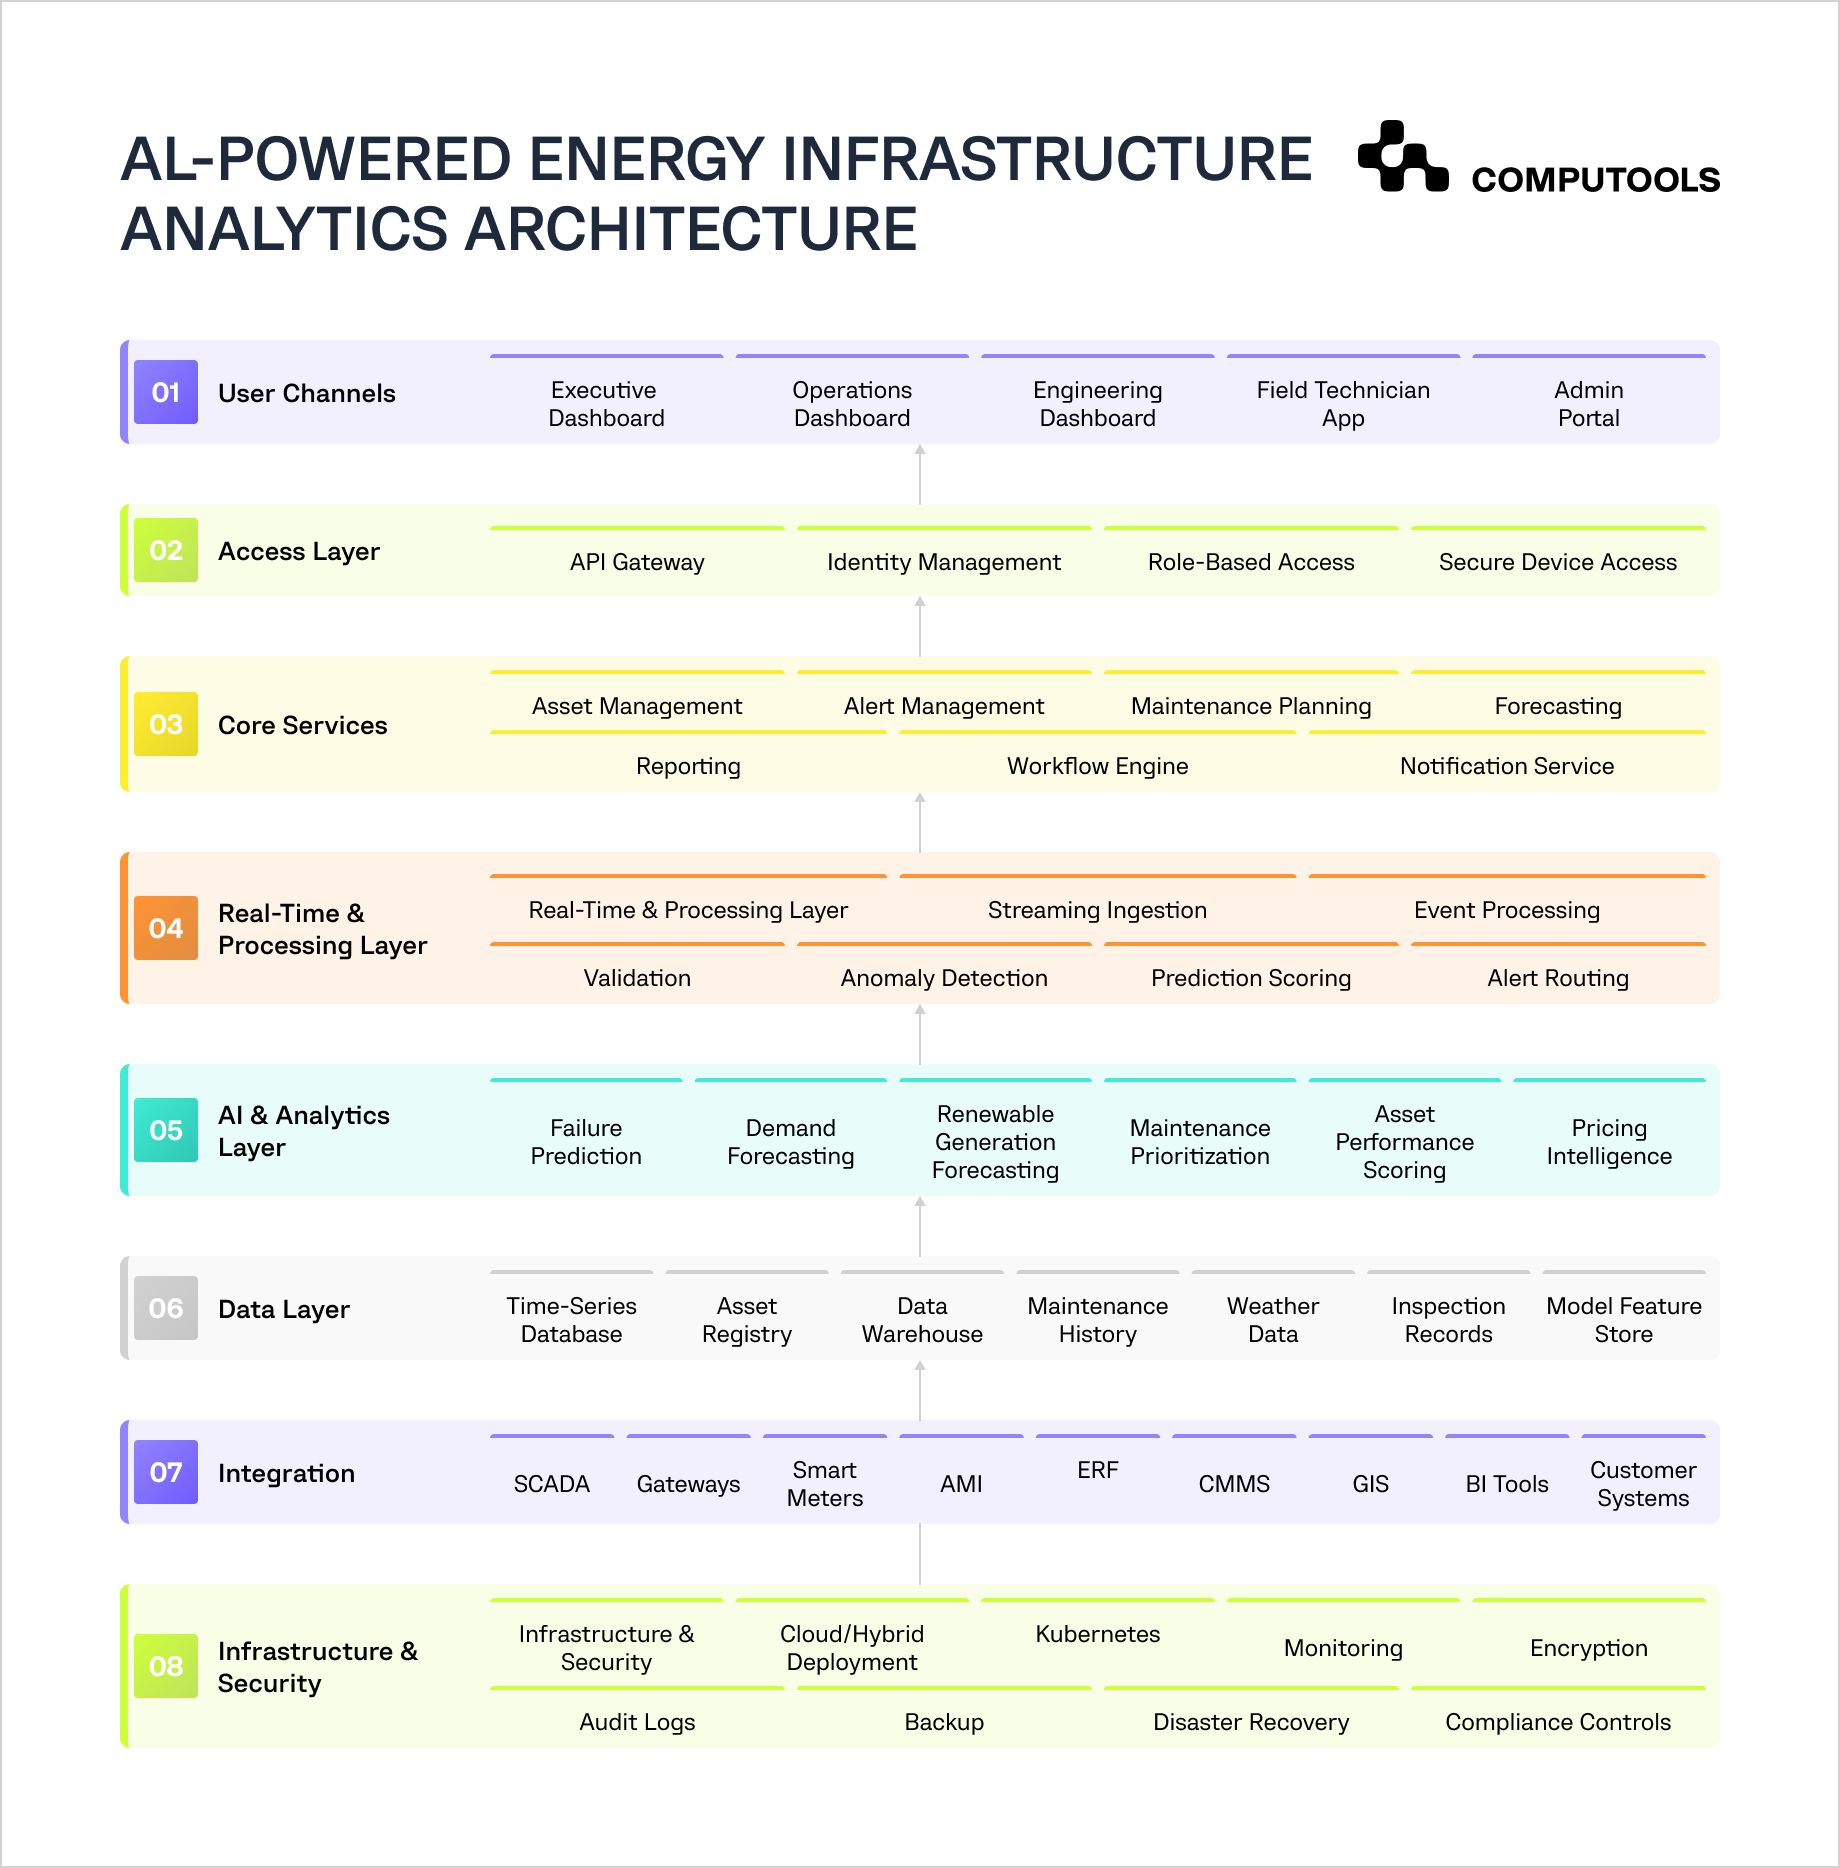
The architecture should separate these workloads. A practical structure includes edge devices or gateways, an API gateway, a streaming layer, validation logic, time-series storage, operational databases, an analytics warehouse, an ML layer, dashboards, admin tools, field apps, and notifications.
With this setup, the business has improved control over cost, speed, and reliability. Real-time logic addresses immediate problems while batch analytics deals with complex issues and long-term assessments.
The system must also contain event severity rules. For example, a low-risk anomaly may simply show up on a dashboard. Conversely, a high-risk event may require a more formal escalation. Creating a work order and notifying a manager and/or confirming that a critical action has been completed may be necessary for a critical event.
Poor architecture can make the platform slow, expensive, or unreliable. A batch-only system may miss urgent equipment risks. A fully real-time system may process too much low-value data and overload teams with alerts. The platform should include message queues, retry logic, offline buffering, fallback rules, and system health monitoring so it can work across remote sites and mixed technology environments.
4. Build Predictive Models Around High-Value Energy Use Cases
Begin by implementing predictive models to address quantifiable operational challenges. Energy teams don’t require AI for every possible task. They need predictive models to help minimize downtime and assist with planning, cost and revenue protection.
Some of the most valuable models are built around predicting failure, forecasting demand or renewable generation, detecting anomalies, prioritizing maintenance, and scoring asset performance. For instance, smart grid predictive analytics could be used by a utility to predict which assets are likely to fail and disrupt service. An industrial energy analytics model could be used by an industrial player to identify increasing energy use across its operational sites.
The technical logic should combine historical data, live readings, asset context, weather data, maintenance history, and operating conditions. The system should also show confidence levels and reason codes, so teams understand why the model raised a warning.
When this step is ignored, AI can become difficult to trust. Models may create too many false alerts, miss rare events, or produce predictions that teams cannot explain. The platform should include model monitoring, retraining logic, human feedback, and threshold tuning from the start.
5. Connect Predictions With Operational Workflows
Predictions should lead to action. The business value remains restricted if the platform only recognizes a failure risk without generating a task, notifying someone, or changing the maintenance plan.
It is up to the company to determine the optimal target for a prediction, whether this is in a dashboard, field app, CMMS, ERP, SCADA system, GIS, BI, a direct notification, or a customer portal. As an example, a transformer that scores in the red might automatically create and prioritize a maintenance task and attach a set of diagnostics and notify the manager.
The system design must include APIs, workflow rules, and logic for escalations as well as audit and administrative controls. Business units must have the capability to set, change, and configure notification thresholds, routing of alerts, ownership of tasks, and approval without needing developers to make the changes.
In the Winder project, Computools connected device data, predictive logic, and system configuration. This same principle applies here: predictive analytics becomes useful when it fits the way infrastructure teams already manage assets, incidents, maintenance, and reporting.
6. Add Modern AI Capabilities With Clear Business Value
AI in the energy sector can make planning workflows smoother, but each of its functions ought to serve a purpose for the business.
It can make recommendations on required maintenance, prioritization for replacement, inspection schedules, and how to best balance the grid. A smart search function can make finding asset alerts, inspection notes, and maintenance histories effortless and quick. Demand forecasting can assist in the planning of capacity, purchases, and even the workforce. Anomaly detection can find abnormal consumption patterns and may also help with identifying issues with the metering system, devices, and even fraud.
Customer or site segmentation can group sites or customers by consumption patterns and other distinguishing factors. Pricing intelligence can assist with expected changes in cost, tariff forecasting, and demand-response planning. AI can also recommend steps for technicians and operators based on the asset’s history and readings.
AI features will only be as good as the data they are built on. If records of your assets, sensor data, timestamps, and maintenance logs aren’t accurate and consistent, neither will be the recommendations. Advanced AI features can be added only after effective data engineering is implemented.
AI-powered energy management solutions will only be as good as the data they are built on. If records of your assets, sensor data, timestamps, and maintenance logs aren’t accurate and consistent, neither will be the recommendations. Advanced AI features can be added only after effective data engineering is implemented.
For assets such as wind turbines, power lines, substations, and solar farms, drone inspections can provide important context for AI-driven maintenance decisions.
Read Computools’ guide on AI-powered drone inspection software for energy infrastructure.
7. Build Security, Reliability, and Governance Into the Platform
Energy data affects continuity, trust, compliance, and revenue. Weak security affects the quality of the data that the system was designed to collect, and erodes trust and increases support load.
Role-based access control, multi-factor authentication, encryption, secure APIs, and device authentication should be implemented along with audit logs, backups, and a suite of monitoring and data retention services.
Access levels should be adjusted according to user roles. Executives should have the ability to view risk and performance summaries, while engineers should be able to view technical readings. Field teams need functionality to submit inspection updates, while admins require tools to modify impact thresholds, manage roles, access, and system integrations.
Reliability is just as important as security. Given the nature of energy infrastructure and how it can operate in remote locations with less-than-stable connectivity and with a mix and mash of legacy systems, the platform should support message queues, retry logic, offline buffering, and deduplicated alerts, with failover and disaster recovery capabilities.
8. Test the Platform With Real Operating Scenarios
Predictive analytics software as well as energy infrastructure monitoring software should be assessed against the actual behavior of energy infrastructure in the field. A demo environment is insufficient to identify every issue that may arise due to device disconnections, delayed data transmissions, slow integration, and high user loads.
The scope of testing should include load testing, API testing, data and workflow testing, security testing, integration testing, model and alert rule testing, and field app usability testing, as well as failover and access control testing. In addition, teams should account for scenarios such as sensor failures, demand spikes, and false alerts, as well as delayed readings, missing data, integration, and access control.
The organization is to include operations, asset management, field service, and executive staff for assessment. Technical tests may miss functional issues such as poor mobile field usability, missing asset histories, and numerous low or no value alerts. Unclear alerts may also be an issue.
This step reduces execution risk ahead of scaling the platform to additional sites, assets, users, and data sources.
Post-launch optimization turns the platform into a long-term energy asset performance management system. It keeps predictive analytics connected to real operations instead of freezing the product around first-release assumptions.
Launch your AI-powered energy analytics platform within 1–3 months instead of years, and transform energy infrastructure data into a strategic advantage.
Why choose Computools for predictive analytics energy software development
Predictive analytics for utilities and energy infrastructure often fails when used as a dashboard, a reporting layer, or a separate AI module. The main barriers are often inadequate integration of asset data, slow detection of faults, insufficient forecasting, a disconnected view of maintenance, and aging systems that poorly manage distributed networks.
Computools addresses these issues by designing predictive analytics platforms as operating systems for energy assets, teams, and decisions.
Computools’energy software development services focus on converting raw infrastructure data into earlier warnings, clearer priorities, and faster operational action. Instead of giving teams another place to check historical reports, the platform can detect risk patterns, rank asset urgency, trigger workflows, and support decisions before problems affect performance.
Clients gain a clearer view of what is happening across sites, devices, and asset groups. Operations leaders can identify rising failure risk. Maintenance teams can plan inspections based on actual asset conditions rather than fixed schedules. Executives can track cost exposure, asset health, energy losses, and infrastructure risk through structured analytics instead of scattered spreadsheets and delayed updates.
Computools also brings experience from adjacent asset-heavy environments. Its oil and gas software development expertise is relevant for companies managing distributed equipment, field operations, inspections, safety risks, and complex technical data. Its electric power software development experience supports platforms connected to grid assets, metering data, load forecasting, utility reporting, and operational workflows.
The advantage for clients is practical and measurable. Teams perform fewer manual monitoring duties, react faster to out-of-the-ordinary situations, utilize maintenance capacity more efficiently, and refine their planning of IT resources for strategically important assets. When the platform integrates with CMMS, ERP, SCADA, IoT, GIS, and BI, the predictive output goes to the systems where the most operational work is done.
Computools applies mobile app development service to give field engineers access to asset history, notifications, inspection checklists, and work orders from remote locations. Our web development services support executive dashboards, operations portals, engineering interfaces, reporting tools, and admin panels where users need accurate infrastructure data without delays.
The AI layer depends on the quality of the data behind it. Computools uses data engineering to organize sensor readings, asset records, maintenance history, weather data, energy consumption data, and enterprise system inputs into a structure that predictive models can trust. AI development then turns this foundation into demand forecasts, anomaly detection, failure prediction, maintenance recommendations, and automated decision support.
As a result, clients get more than predictive models. They get a platform that can reduce emergency repairs, improve asset availability, protect revenue from energy losses, lower reporting workload, and scale analytics across more assets, users, sites, and integrations. Computools connects predictive analytics with the wider business system, giving energy companies stronger control over infrastructure performance and long-term operational growth.
For companies comparing technology partners in the utility sector, Computools also prepared a practical overview of the best electric power utility software development companies. It can help decision-makers evaluate vendors by energy experience, technical capability, integration expertise, and operational impact.
Final thoughts
The best predictive analytics energy software is one that companies incorporate into their operational systems. It should integrate field assets, real-time and historical data, signals, AI models, and workflows along with maintenance, enterprise systems, and executive decisions into one operational platform.
For companies in utilities, energy, and infrastructure, the solution is powerful and practical. It allows teams to spot the failures of assets, predict demand with more precision, mitigate the need for unplanned repairs, and optimize maintenance tasks. It gives leadership insight into the condition of their assets, the energy they are losing, the operational risk exposure they face, and where they should invest next.
The platform’s prediction capability is dependent on the system’s infrastructure. Predictive analytics are only useful when integrated with the organization’s operations and supported by the system’s architecture, clean data, secure and flexible integrations, sound forecasting logic, and iterative modeling. The goal of every alert, prediction, and suggestion is to facilitate and integrate faster, less risky, and more effective control of the infrastructure.
Computools
Software Solutions
Computools is an IT consulting and software development company that delivers innovative solutions to help businesses unlock tomorrow.


