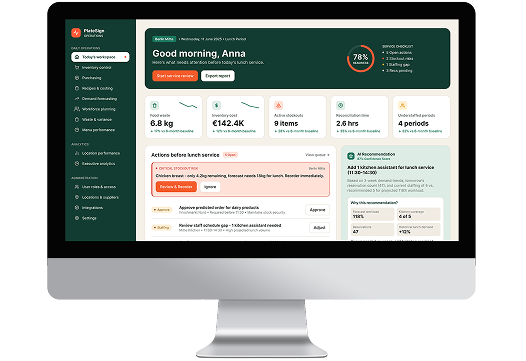
The client operated 38 restaurants and cafes across Germany, Austria, and the Czech Republic. Rapid expansion created inconsistent inventory practices, fragmented purchasing routines, manual reconciliation, and limited visibility into location-level profitability.
The group needed restaurant operations management software that could connect inventory, procurement, recipes, workforce planning, POS data, and executive analytics in one operational environment. Managers needed recommendations before service periods, not reports after losses had already reached monthly results.
Computools delivered PlateSign Operations, a unified platform for restaurant inventory management, recipe costing, purchasing recommendations, demand forecasting, workforce planning, and location-level performance visibility. Within six months of phased adoption, the client reduced food waste by 17%, lowered inventory costs by 12%, cut stockouts by 28%, and shortened inventory reconciliation time by 35%.
The client is a multi-brand hospitality operator serving urban professionals, families, and travelers through casual dining restaurants, bakery cafes, and compact city-center formats.
Its portfolio combined established regional concepts with newer locations built for delivery, takeaway, and high-volume lunch service. Each format had different demand patterns, staffing needs, supplier routines, and preparation cycles.
The group needed restaurant workforce management software capabilities because staffing decisions had to reflect expected workload by daypart, sales channel, and location. Leadership also needed restaurant analytics that connected sales, ingredients, waste, labor, supplier prices, and recipe margins into a single, comparable view across brands.
The central challenge was margin erosion hidden inside daily restaurant operations. Sales, purchasing, inventory, recipe, and labor data existed in separate systems, making it difficult to identify waste, stock risks, and cost variance before they affected profitability.
The client needed HoReCa software development grounded in restaurant workflows and travel & hospitality software development experience with multi-location operations, role-based access, phased rollout, and operational KPI validation.
Computools designed PlateSign Operations as an AI restaurant operations platform for restaurant managers, regional operations teams, procurement, finance, and executives. The system connected POS, supplier, accounting, workforce, inventory, and recipe data into a shared operational model.
The shared operating model mapped menu items to recipes, ingredients, supplier prices, sales channels, stock movements, and labor demand. This gave teams a consistent view of how purchasing, preparation, staffing, and menu decisions affected waste, availability, and margin.
Machine-learning services powered restaurant demand forecasting software, replenishment recommendations, anomaly detection, and workload prediction using sales history, daypart patterns, channels, calendar events, promotions, weather, and location signals. Computools applied AI development to keep outputs explainable, reviewable, and controlled by restaurant managers, while Claude and Gemini integrations supported natural-language analysis and management-level queries over connected restaurant data.
Purchasing workflows supported restaurant purchasing automation by converting forecasted demand, stock levels, supplier prices, and recipe requirements into recommended purchase quantities by venue and ingredient. Managers could accept, adjust, or reject recommendations while keeping control over final orders.
PlateSign Operations also supported restaurant recipe cost management by linking recipes with ingredient usage, supplier price changes, theoretical consumption, physical counts, and contribution margin.
Waste logging, variance detection, and role-based dashboards helped managers identify losses, review operational KPIs, and act on recommendations before service. Leadership gained a consistent view of margin, waste, availability, and labor coverage across the group.
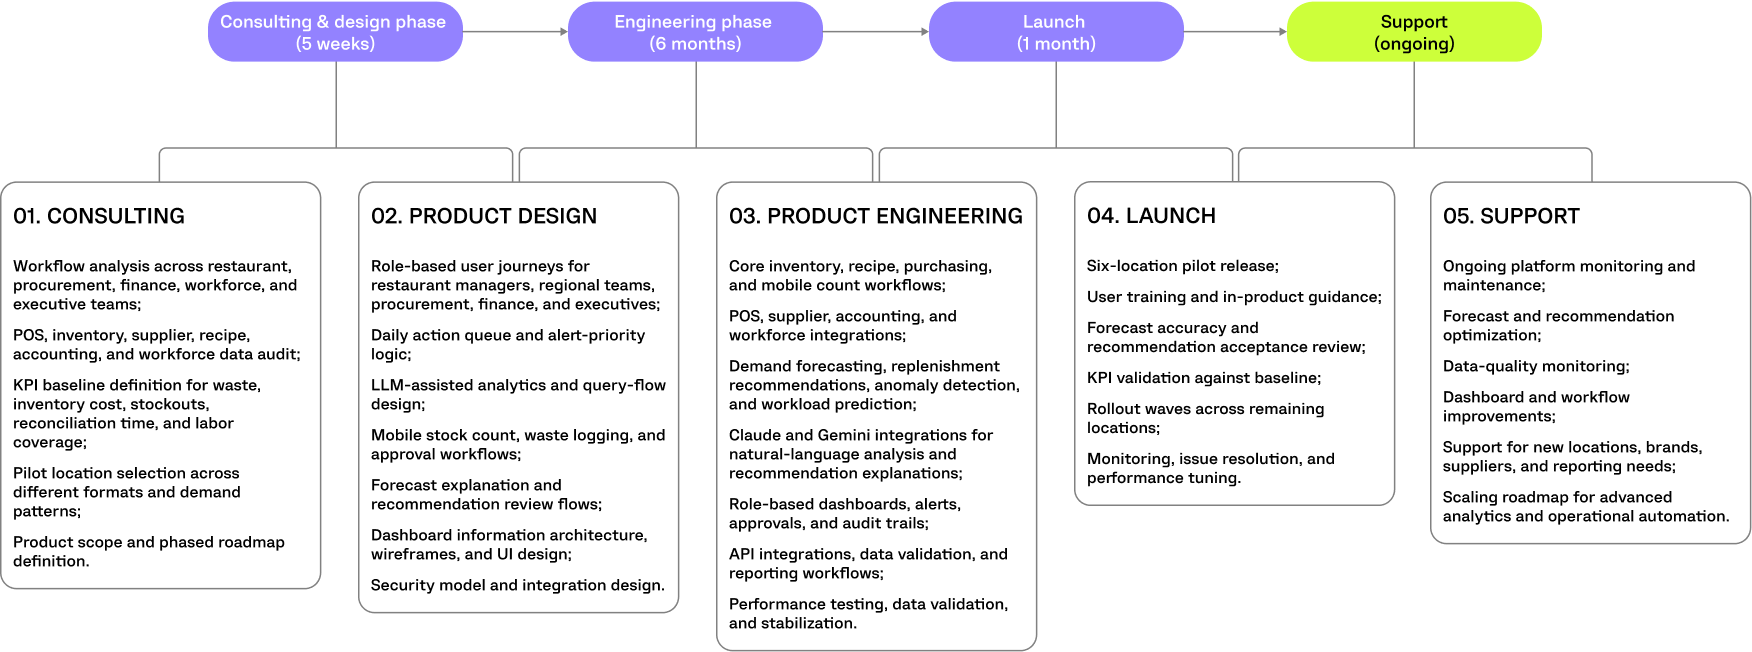
The phased rollout began with six pilot locations representing different restaurant formats and demand patterns. After validating data quality, forecast accuracy, and manager adoption, Computools expanded PlateSign Operations across the remaining venues.
Within six months of phased adoption, the client achieved measurable improvements across waste, inventory costs, stock availability, reconciliation, and labor planning:
Forecast-guided preparation and earlier variance alerts strengthened restaurant food waste management by reducing excess production, expiry losses, and recurring preparation mistakes. Automated replenishment recommendations helped managers order closer to expected demand and maintain better ingredient availability.
Standardized counts, mobile workflows, and automated variance checks shortened weekly reconciliation and reduced manual consolidation. Restaurant managers spent less time preparing status reports, while regional teams could compare locations using the same definitions for waste, inventory, and labor KPIs.
Leadership gained earlier visibility into recipe margin, stock availability, labor coverage, and supplier impact across brands. Standardized sales, purchasing, inventory, recipe, supplier, workforce, and location data also created a stronger base for future data engineering initiatives, including forecasting, reporting, KPI consistency, and operational analytics.
The client selected Computools because the engagement combined restaurant workflow analysis, role-based UX, system integration, data modeling, AI recommendations, cloud delivery, and phased adoption support.
Computools connected technical delivery to measurable operating KPIs: waste, stock availability, reconciliation time, labor coverage, recipe margin, and location-level profitability. This kept development priorities tied to decisions restaurant teams made before each service period.
The delivery team covered business analysis, CX and UX design, software architecture, QA, cloud infrastructure, and launch support within one coordinated roadmap.

The design focused on fast daily decisions, mobile-ready workflows, and role-based visibility for restaurant, regional, purchasing, finance, and executive teams.
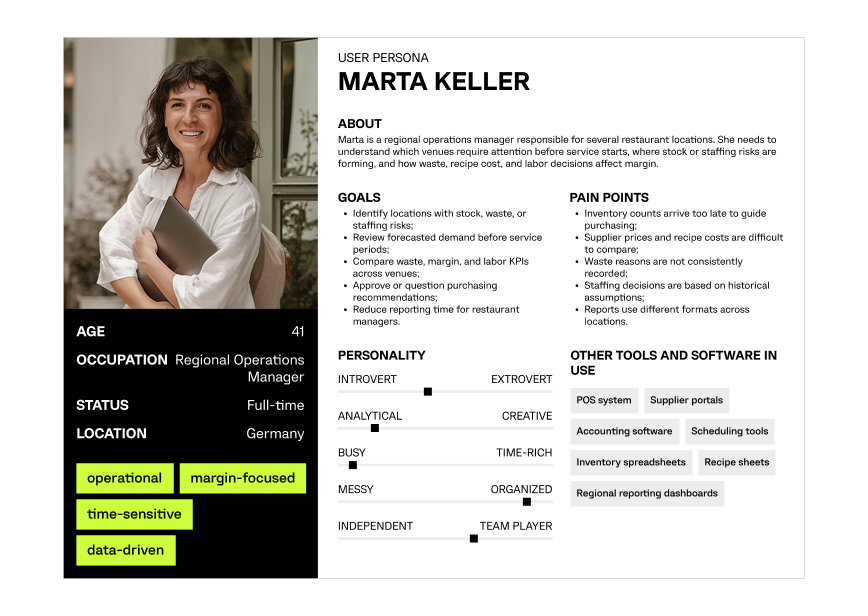
Defining restaurant operations needs, inventory workflows, purchasing decisions, workforce planning, and margin visibility.
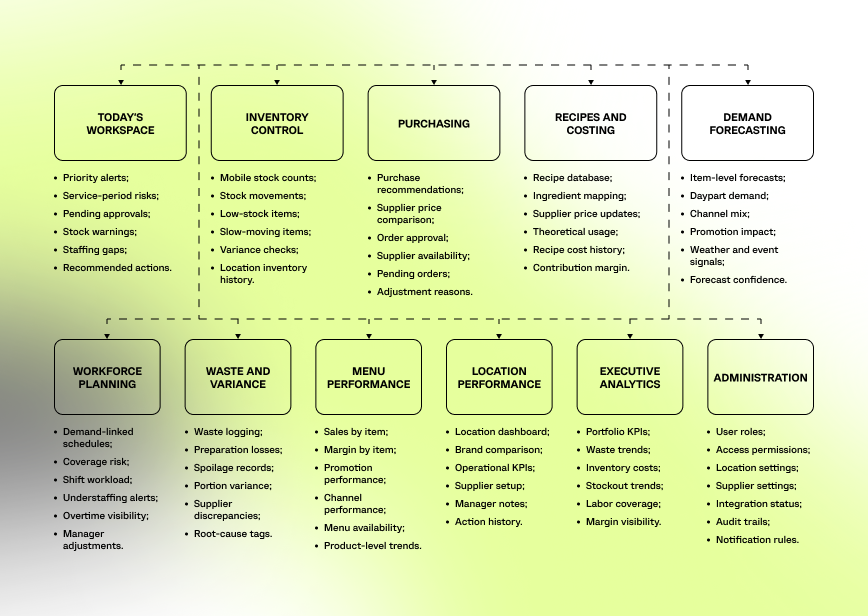
Structuring the platform around daily restaurant decisions: inventory, purchasing, forecasting, workforce planning, waste control, and margin visibility.
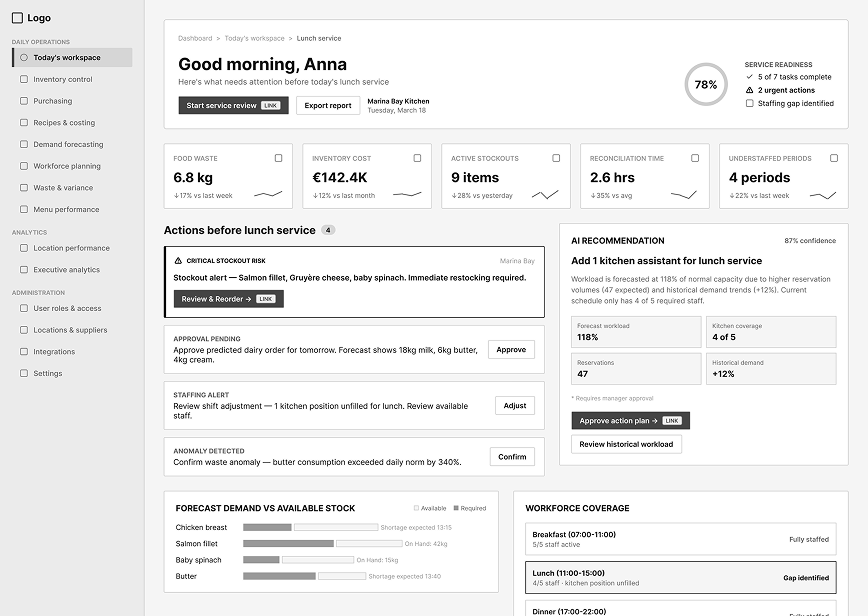
Designing low-fidelity layouts for daily action queues, mobile stock counts, purchase approvals, demand forecasts, workforce risks, waste logging, and executive analytics.
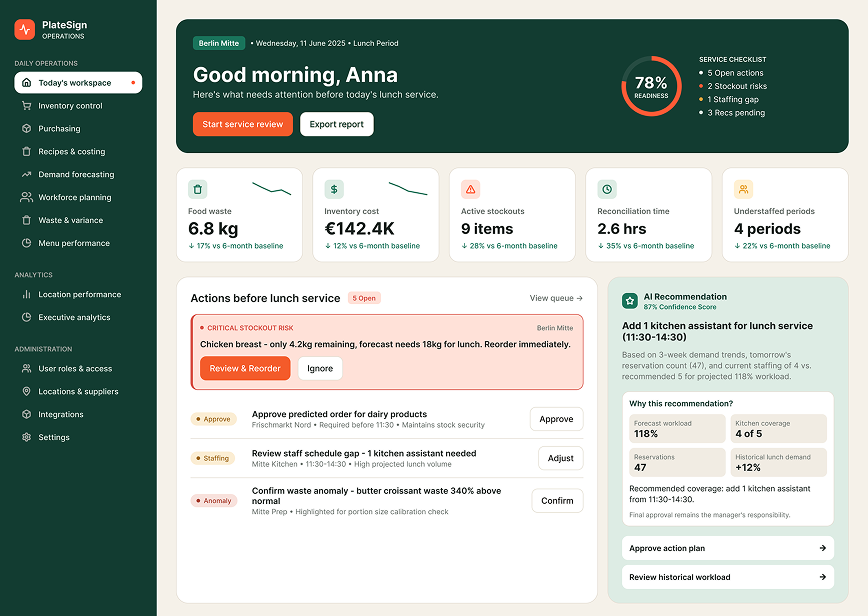
A responsive web interface with a mobile-ready PWA let managers act faster and gave regional and executive users drill-down access from portfolio KPIs to location, recipe, supplier, and shift-level data.

TypeScript
TypeScript provided a shared engineering foundation across frontend and backend services, improving reliability as inventory, purchasing, workforce, and analytics workflows expanded across brands and locations.

React
React powered role-based interfaces for restaurant managers, regional teams, procurement, finance, and executives. The PWA supported mobile stock counts, waste logging, purchase approvals, service-period alerts, and location-level KPI views.

Node.js and Express.js
Node.js and Express.js handled application logic, workflow orchestration, approvals, notifications, API endpoints, REST integrations, webhooks, and scheduled data pipelines for POS, supplier, accounting, and workforce systems.

PostgreSQL
PostgreSQL stored standardized products, recipes, locations, stock movements, orders, schedules, sales, and KPI history. Transactional reliability supported auditable restaurant operations and consistent reporting.

Python and FastAPI
Python and FastAPI powered demand forecasting, anomaly detection, replenishment recommendations, and workload prediction using sales, calendar, weather, promotion, channel, and location signals.

AWS, Docker, and Terraform
AWS, Docker, and Terraform supported separate test and production environments, repeatable deployments, infrastructure automation, monitoring, and scalable processing for multi-location operational data.

Claude and Gemini integrations
LLM integrations supported natural-language analysis, recommendation explanations, and management-level queries over connected restaurant operations data. Outputs were controlled through structured data access, predefined prompt flows, and manager review.
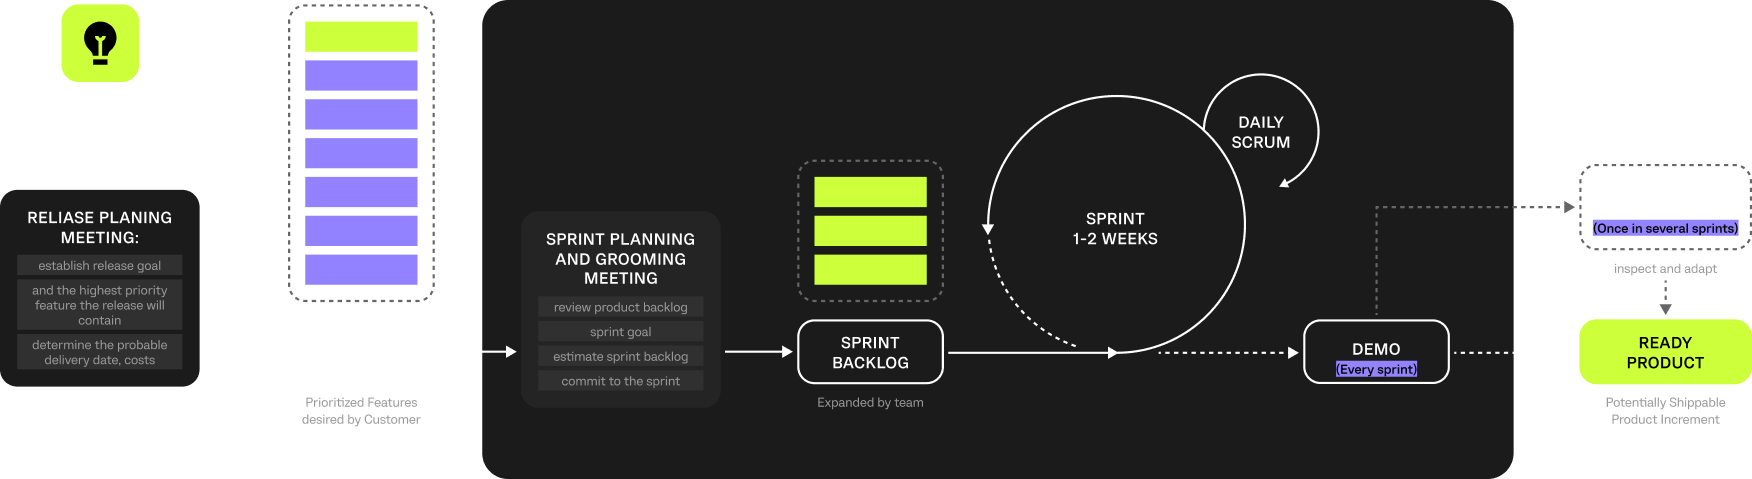
Computools used two-week Scrum iterations with frequent user validation and measurable acceptance criteria. Each sprint tied technical delivery to operational KPIs, including waste, stock availability, reconciliation speed, labor coverage, recipe margin, and location-level profitability.
The phased rollout reduced integration and adoption risks. Pilot locations covered different brands, venue sizes, and sales-channel mixes, with forecast accuracy, recommendation acceptance, data completeness, and operational KPIs reviewed before each rollout wave.
Manager and regional stakeholder feedback shaped mobile inventory workflows, purchase approvals, forecast explanations, alert priorities, LLM-assisted analytics, and dashboard navigation.
Before PlateSign, every location had part of the answer, but nobody had the complete picture. Our managers can now see the operational and financial effect of a decision before it becomes a monthly variance. The platform reduced waste, simplified planning, and created a more consistent way of working across the group.




Computools | 341 Raven Cir, Camden Wyoming, Delaware 19934, US