StockBalance AI

How StockBalance AI helped a multi-warehouse retailer rebalance inventory across seven fulfillment centers.

case image

AT A GLANCE

The client is a USA-based multi-brand e-commerce retailer operating seven regional fulfillment centers. As order volumes and SKU assortment expanded, popular products regularly sold out in one region while the same items accumulated excess stock in another.

The retailer needed inventory optimization software that could connect warehouse availability, order demand, inbound supply, transfer lead times, fulfillment SLAs, and shipping economics. Planners needed earlier visibility into regional stock risks to prevent split shipments, cross-zone deliveries, or higher safety stock.

Computools delivered StockBalance AI, an AI inventory management platform integrated with the client’s existing WMS and OMS environments. Within five months of phased adoption, the platform reduced split shipments by 21%, lowered safety stock by 14%, reduced cross-zone parcel costs by 11%, and decreased regional stockouts by 24%.

THE CLIENT

The client is a USA-based e-commerce retailer selling home, lifestyle, consumer electronics, and accessory products through its own storefronts and major online marketplaces. The company fulfilled orders through seven regional distribution centers across the United States. Its distributed warehouse footprint helped keep products closer to customers, but regional demand volatility made inventory positioning harder to manage as the assortment grew.

Existing warehouse inventory management software and OMS tools supported warehouse transactions, stock movements, and order routing. However, they did not continuously determine how much inventory each facility should hold by SKU, region, demand velocity, and service-level target.

Leadership needed a fulfillment optimization platform that could improve inventory placement without replacing the systems already running warehouse execution and order operations.

BUSINESS CHALLENGE

The main challenge was the lack of visibility into future SKU-location demand. The retailer had enough warehouse, order, and supply data to detect imbalances, but planning teams still relied on spreadsheet exports, historical averages, and weekly review cycles.

  • Inventory balancing. Stock was distributed across warehouses based on static rules and historical averages, while regional demand changed faster than planning cycles.
  • Regional stockouts. One warehouse could approach a shortage while the same SKU remained available in another facility.
  • Split shipments. When the nearest fulfillment center could not complete an order, the OMS routed separate order lines to multiple warehouses, increasing packaging, handling, and parcel costs.
  • Cross-zone fulfillment. Orders shipped from distant facilities increased transportation expenses and extended delivery times.
  • High safety stock. Planners compensated for uncertainty by holding larger buffers across multiple locations, tying up working capital.
  • Manual planning workload. Inventory planners spent too much time comparing warehouse exports and identifying transfer needs after imbalances had already affected fulfillment.

The project required warehouse management software development experience across WMS and OMS integration, warehouse operations, SKU-location planning, fulfillment economics, and phased rollout.

SOLUTION SUMMARY

Computools designed StockBalance AI as an inventory intelligence and allocation layer for the client’s multi-warehouse fulfillment network. The platform connected WMS, OMS, procurement, carrier, and planning data into one decision environment.

The system ingested inventory positions, sales orders, order-line velocity, backorders, inbound purchase orders, inter-warehouse transfers, promotions, regional demand patterns, fulfillment lead times, and parcel shipping costs.

The forecasting layer worked as demand forecasting software, generating SKU-location demand forecasts and projected inventory positions for each fulfillment center.

Computools applied AI development to support forecast generation, safety-stock calculation, stockout risk scoring, allocation logic, and recommendation explanations.

Warehouse stockout prediction logic identified future shortages before they affected customer orders. The allocation engine compared projected demand, available stock, inbound inventory, transfer lead time, and fulfillment cost to identify where inventory should move.

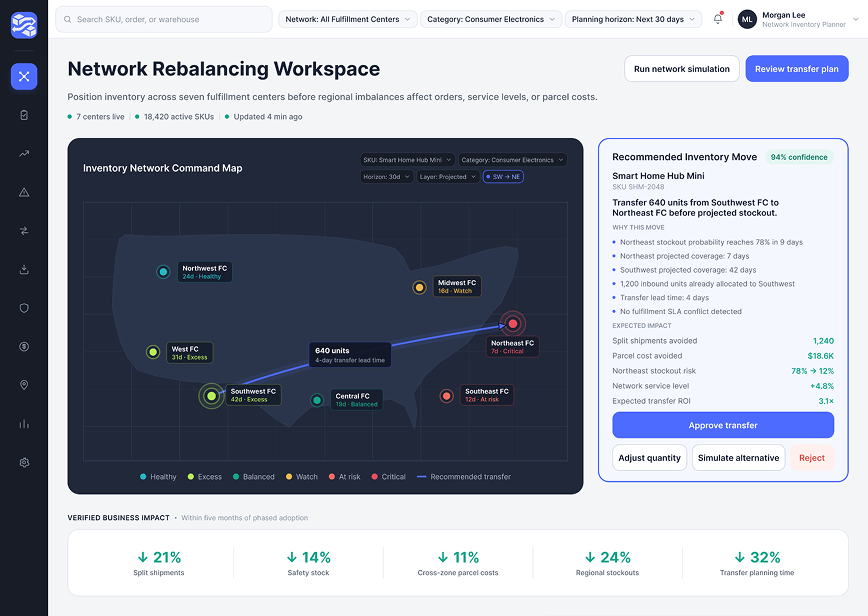
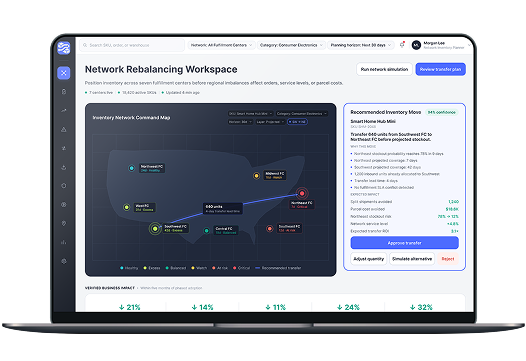
The inventory rebalancing software generated recommended transfers with origin warehouse, destination warehouse, quantity, expected stockout risk, projected days of supply, estimated transportation impact, and confidence level. Planners could approve, adjust, or reject each recommendation.

IMPACT

StockBalance AI was piloted across two fulfillment centers, then expanded after forecast quality, planner adoption, transfer impact, and fulfillment KPIs were validated.

Within five months of phased adoption, the client achieved measurable improvements across inventory placement, fulfillment cost, stock availability, and planning speed:

  • split shipments decreased by 21%;
  • safety stock requirements decreased by 14%;
  • cross-zone parcel shipping costs decreased by 11%;
  • regional stockouts decreased by 24%;
  • inventory transfer planning became 32% faster.

Warehouse stock optimization helped planners position inventory by SKU and region, reducing manual spreadsheet work. Teams could separate network-wide shortages from location-specific imbalances and act before availability issues affected fulfillment.

Earlier rebalancing recommendations improved supply chain inventory optimization by linking stock movements to demand forecasts, service levels, transfer costs, and parcel shipping economics.

WHY COMPUTOOLS

The client selected Computools because the project required warehouse workflow analysis, inventory data modeling, AI forecasting logic, WMS and OMS integration, planner UX, and phased rollout support.

Computools turned fragmented warehouse, order, inbound supply, transfer, and carrier data into a practical decision model for allocation, rebalancing, and stockout prevention.

Delivery priorities were tied to measurable KPIs: split-shipment rate, regional stock availability, safety stock, cross-zone parcel cost, transfer planning speed, and fulfillment SLA performance.

The team covered business analysis, CX and UX design, architecture, AI logic, integrations, QA, rollout validation, and post-launch optimization.

Launch your software solution within 1-3 months instead of years. Unlock tomorrow. Build a future-ready business through innovation.

STORY IN DEPTH

Background

The client’s warehouse network had grown in response to rising order volume and the need to shorten delivery distances. Additional fulfillment centers improved geographic coverage, but each new location also created another inventory decision.

The planning team had to determine how to distribute thousands of SKUs across seven facilities. Existing systems handled separate parts of the process: OMS for order routing, WMS for inventory transactions, procurement tools for inbound supply, and carrier systems for transportation data.

No single environment continuously evaluated these signals together. Planners built weekly spreadsheets from warehouse exports, sales history, open purchase orders, and transfer records. By the time a location-level imbalance became visible, customer orders were often already being fulfilled from suboptimal facilities.

Approach to solution

Computools started by mapping how inventory moved through the network: supplier purchase orders, receiving, storage, customer allocation, warehouse transfers, and final shipment. The team analyzed how planners determined reorder points, safety stock, warehouse allocation, transfer requirements, and fulfillment exceptions. This made it possible to separate transactional warehouse processes from network-level inventory decisions.

The first architectural decision was to preserve the existing systems of record. The WMS continued to manage physical inventory and warehouse execution, while the OMS continued to control customer-order routing. StockBalance AI operated above these systems as an analytical and recommendation layer.

Computools created a standardized network inventory model connecting SKU, fulfillment center, available-to-promise inventory, inbound supply, committed demand, transfer lead time, forecast demand, service-level target, and shipping economics.

The first releases operated in recommendation mode. Planners reviewed each suggested transfer, checked the explanation, adjusted quantities when needed, and approved or rejected the recommendation.

Computools role

Computools acted as the product and technology partner responsible for:

  • analyzing inventory planning, allocation, transfer, fulfillment, and replenishment workflows;
  • mapping integrations and data ownership across WMS, OMS, procurement, and carrier systems;
  • defining the inventory model, KPI framework, and phased implementation roadmap;
  • building the network-wide inventory data and integration layer;
  • developing regional demand forecasting and stockout-risk logic;
  • building allocation, safety-stock, and rebalancing algorithms;
  • designing planner workflows, dashboards, recommendation explanations, and approvals;
  • implementing monitoring, audit trails, access controls, and cloud infrastructure;
  • supporting pilot validation, planner adoption, KPI measurement, and network-wide rollout.

The team worked with stakeholders responsible for inventory planning, fulfillment operations, procurement, transportation, analytics, and executive reporting.

Key decisions and outcomes

The first key decision was to optimize inventory at the SKU-location level. A network could appear to have enough total stock even as individual warehouses approached shortages. This helped planners detect local imbalances before they became customer-facing availability issues.

The second decision was to include fulfillment economics in allocation recommendations. StockBalance AI evaluated the expected benefit of a transfer against transfer cost, projected demand, stockout probability, service-level risk, and downstream parcel expenses.

The third decision was to preserve planner control. Every recommendation showed expected demand, current availability, projected days of supply, inbound inventory, transfer lead time, service-level risk, and estimated cost impact.

The completed platform moved inventory planning from periodic reconciliation to continuous network-level decision support.

DESIGN

The design focused on exception-driven planning, SKU-location visibility, transfer recommendations, stockout risk, and network-level fulfillment economics.

USER PERSONA → SITE MAP → WIREFRAMES → USER INTERFACE

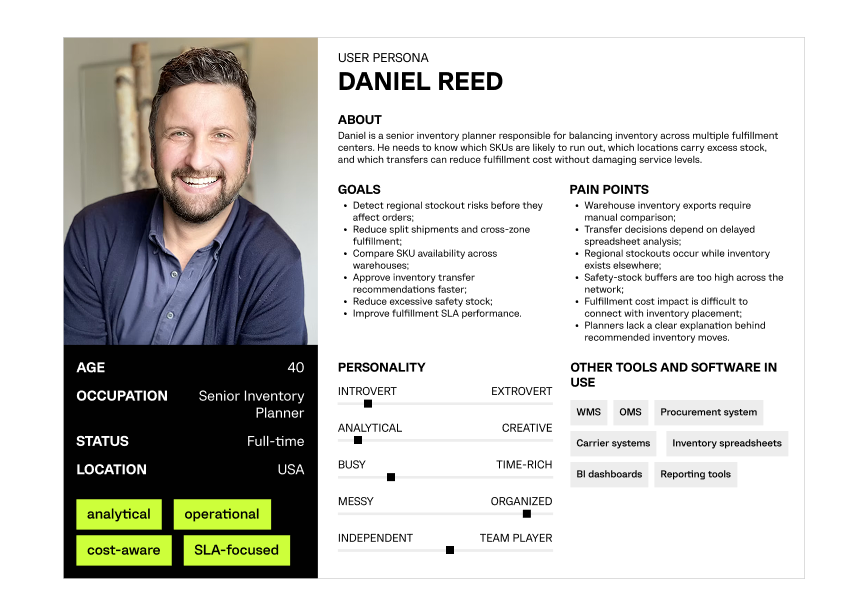
USER PERSONA

Defining warehouse planning needs, fulfillment risks, inventory transfer workflows, stock availability, and network cost visibility.

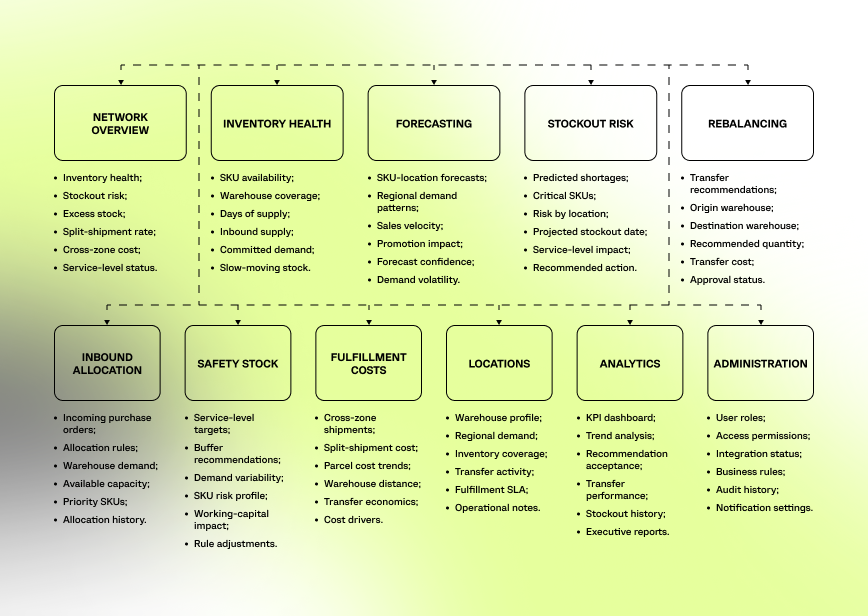
SITE MAP

Structuring the platform around network inventory visibility, SKU-location risk, transfer recommendations, and fulfillment economics.

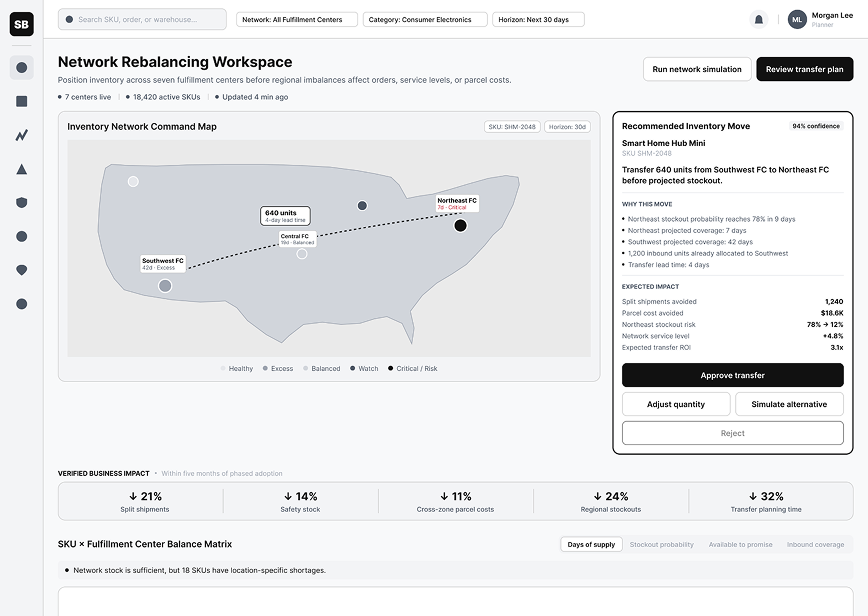
WIREFRAMES

Designing low-fidelity layouts for network inventory views, stockout-risk queues, SKU-location analysis, transfer approvals, safety-stock rules, fulfillment-cost comparison, and executive dashboards.

USER INTERFACE

The interface gave planners one place to review inventory risk, compare warehouse positions, approve transfers, and track fulfillment impact across the network.

DIGITAL PLATFORM & TECHNOLOGY

Computools delivered web development for StockBalance AI, combining planner workflows, network inventory dashboards, transfer approvals, forecast views, fulfillment-cost analytics, and role-based access.

PROJECT MANAGEMENT METHODOLOGY

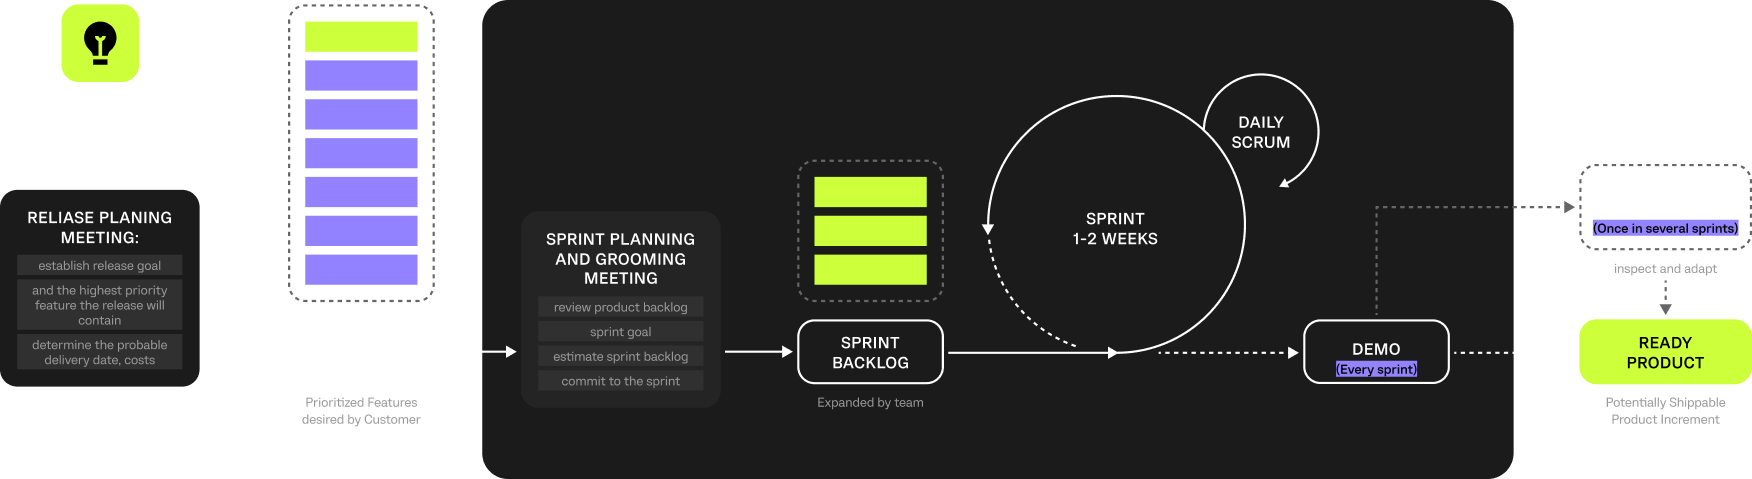
Computools used Scrum with two-week iterations, stakeholder demos, and KPI-based acceptance criteria. Each sprint connected a platform capability to a measurable operational outcome: split shipments, stock availability, safety stock, transfer planning speed, or fulfillment cost.

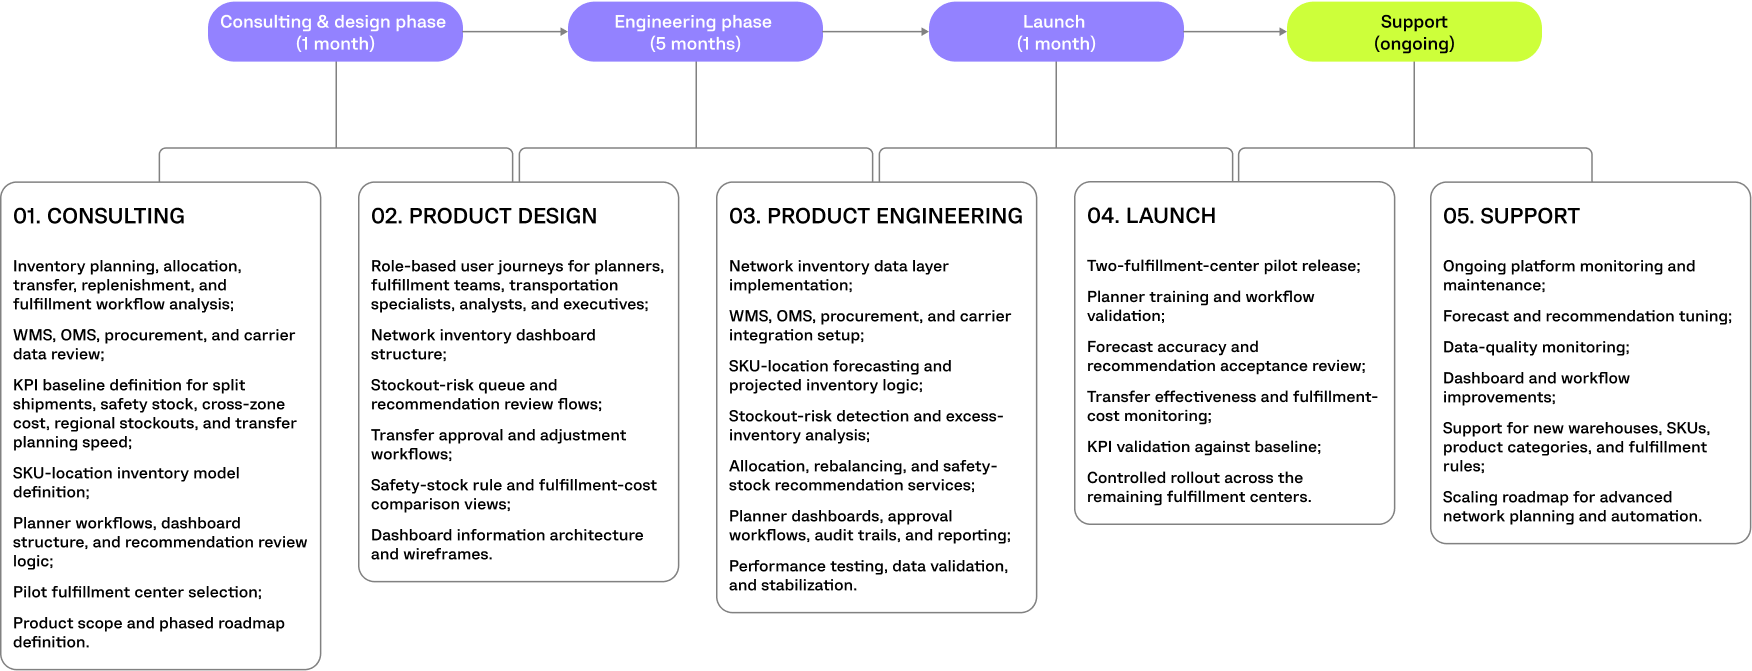
The team started with workflow mapping, WMS and OMS data review, and SKU-location inventory modeling. Forecasting, stockout-risk detection, and rebalancing recommendations were introduced after data completeness and inventory consistency reached agreed thresholds.

Two fulfillment centers were selected for the pilot. The locations represented different regional demand patterns, allowing the team to validate forecast quality, recommendation acceptance, transfer effectiveness, and fulfillment impact before network-wide rollout.

PROJECT MANAGEMENT METHODOLOGY

PROJECT TIMELINE

image

WHAT OUR CLIENT SAID

Before StockBalance AI, we knew how much inventory we owned, but we could not always tell whether it was in the right place. Computools helped us see inventory risk across the network early enough to act on it. We reduced split shipments, lowered buffer stock, and gave planners a clearer way to manage regional availability.

CONTACT US TO GET A COST-EFFECTIVE
PROJECT ESTIMATE

Thank you for your message!

Your request will be carefully researched by our experts. We will get in touch with you within one business day.

WHAT HAPPENS NEXT?

01.
We deeply analyse your request.
02.
We create project roadmap, accelerating your time-to-value.
03.
We co-scope features, minimizing project risk upfront.
04.
We submit a comprehensive project proposal with estimates, timelines, CVs, etc.
Trusted by: