THE AUTHOR:

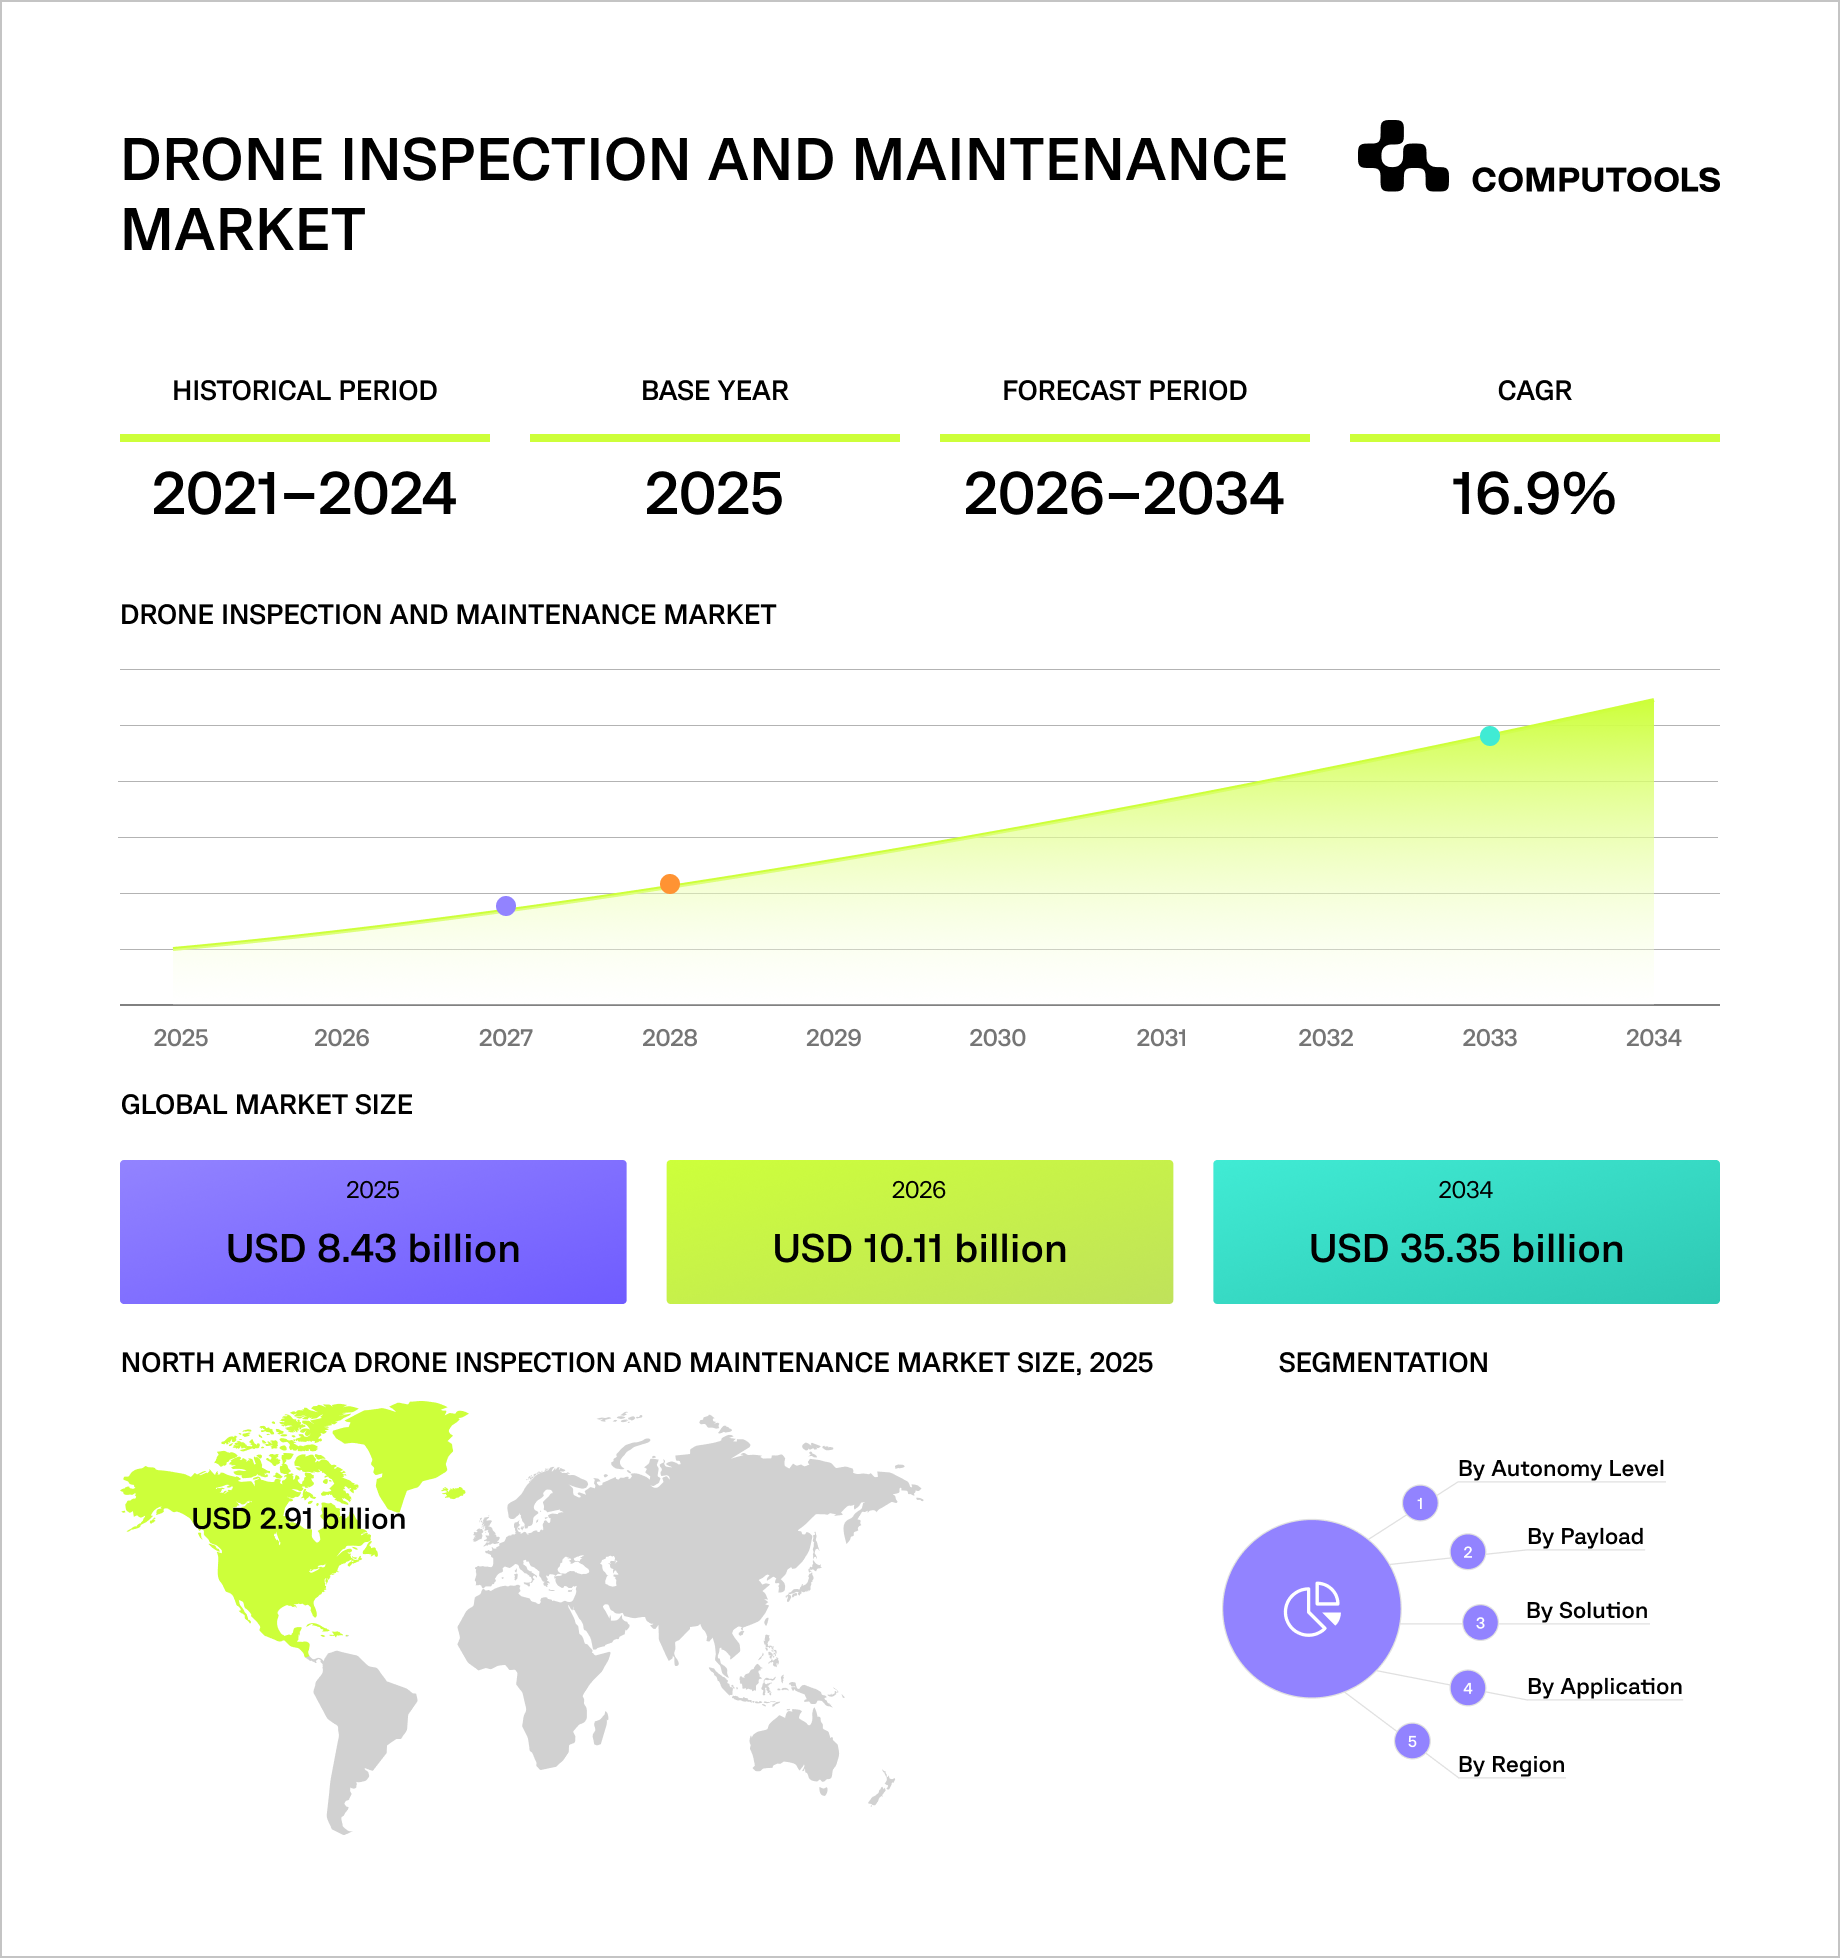
Renewable energy expansion is increasing the volume of distributed infrastructure that utilities and energy companies need to inspect, monitor, and maintain. The International Energy Agency projects nearly 4,600 GW of new renewable power capacity between 2025 and 2030, while GWEC reports that global wind power reached 1,299 GW in 2025, following a record 165 GW of new installations.
The inspection drone market is also expanding, with Fortune Business Insights valuing the global drone inspection and maintenance market at USD 8.43 billion in 2025 and projecting it to reach USD 35.35 billion by 2034. The same report identifies energy inspection as the leading application segment, driven by grid expansion, renewable buildout, and stricter uptime targets. To build drone inspection software for this environment, energy companies need a system that can centralize inspection data, automate defect analysis, prioritize maintenance tasks, and connect drone findings with operational workflows.
Computools has practical expertise in building energy software systems that connect asset data, analytics, automation, and maintenance workflows. This gives us a clear basis for explaining how AI-powered drone inspection software should be designed to support real operational decisions.
How Computools helped build drone inspection software for wind turbine monitoring
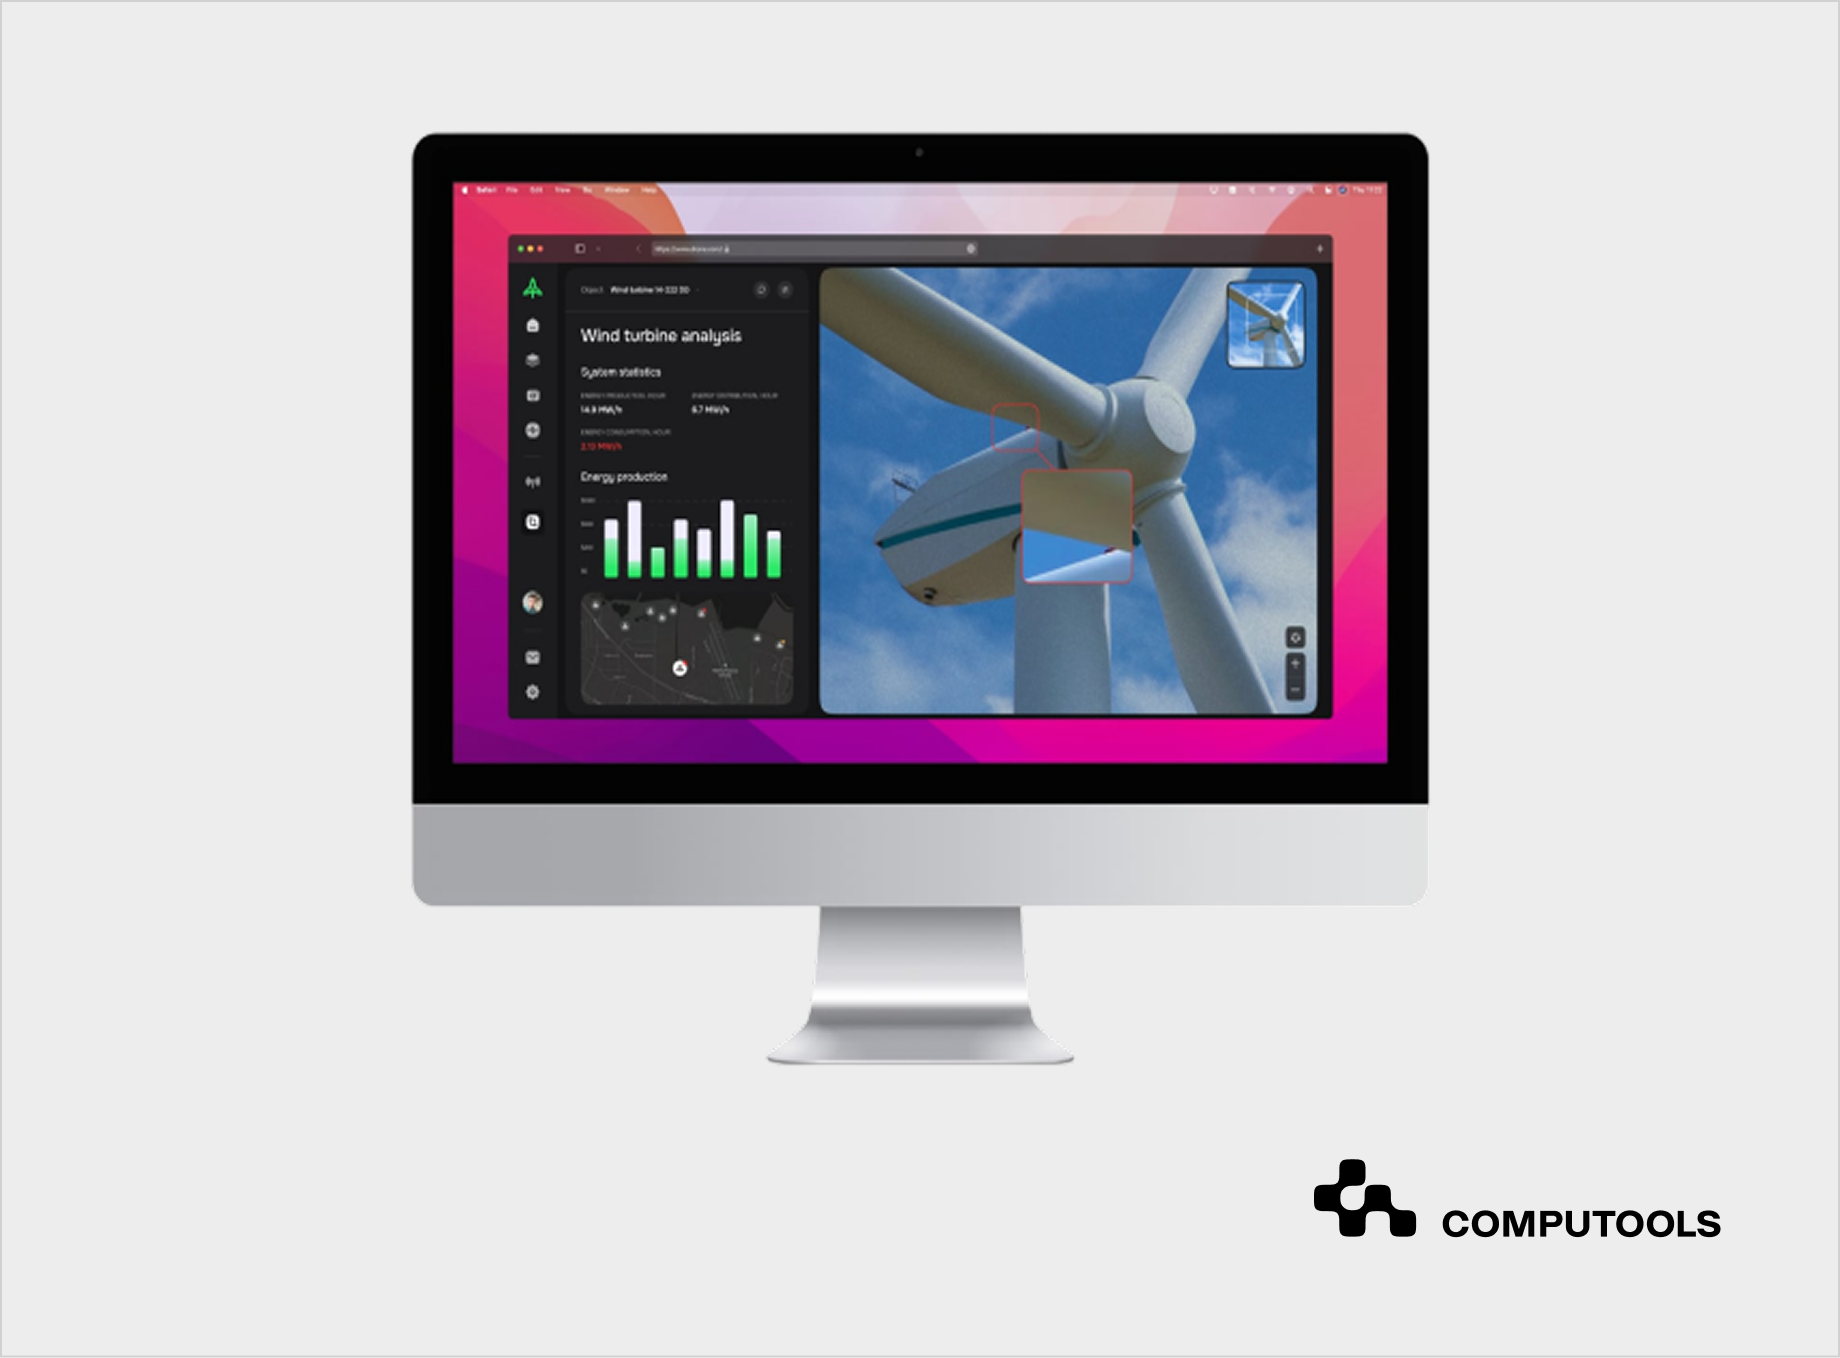
Computools worked with a global wind turbine manufacturer that needed to improve how inspection data was collected, stored, analyzed, and used for maintenance planning. The client had installed more than 173 GW of wind turbines across 88 countries, so inspection data management directly affected turbine uptime, operational costs, and field team workload. Reports arrived in different formats, including JSON and PDF, and were stored across separate locations, which slowed access to inspection results and made manual analysis inefficient.
This made the project a practical example of how drone inspection software can move beyond report storage and become part of maintenance planning.
As part of its energy software development services, Computools developed a centralized system to manage CIR (Critical Inspection Reports) and BIR (Basic Inspection Reports) reports. The platform structured inspection data by turbine condition, automated the extraction of blade damage categories and assessment statuses, and helped engineers use report data for faster maintenance prioritization.
The solution also required AI development expertise to support automated report analysis and business logic for prioritizing maintenance tasks. A user-friendly interface, built through Computools’ web development services, gave teams direct access to inspection data, report history, and operational insights. This created a stronger foundation for drone data analysis for energy sector teams. It also helped the client reduce manual review, operational costs, and high-altitude tasks while increasing mean time between failures by 5%.
11 steps on how to build AI-powered drone inspection software for energy infrastructure monitoring
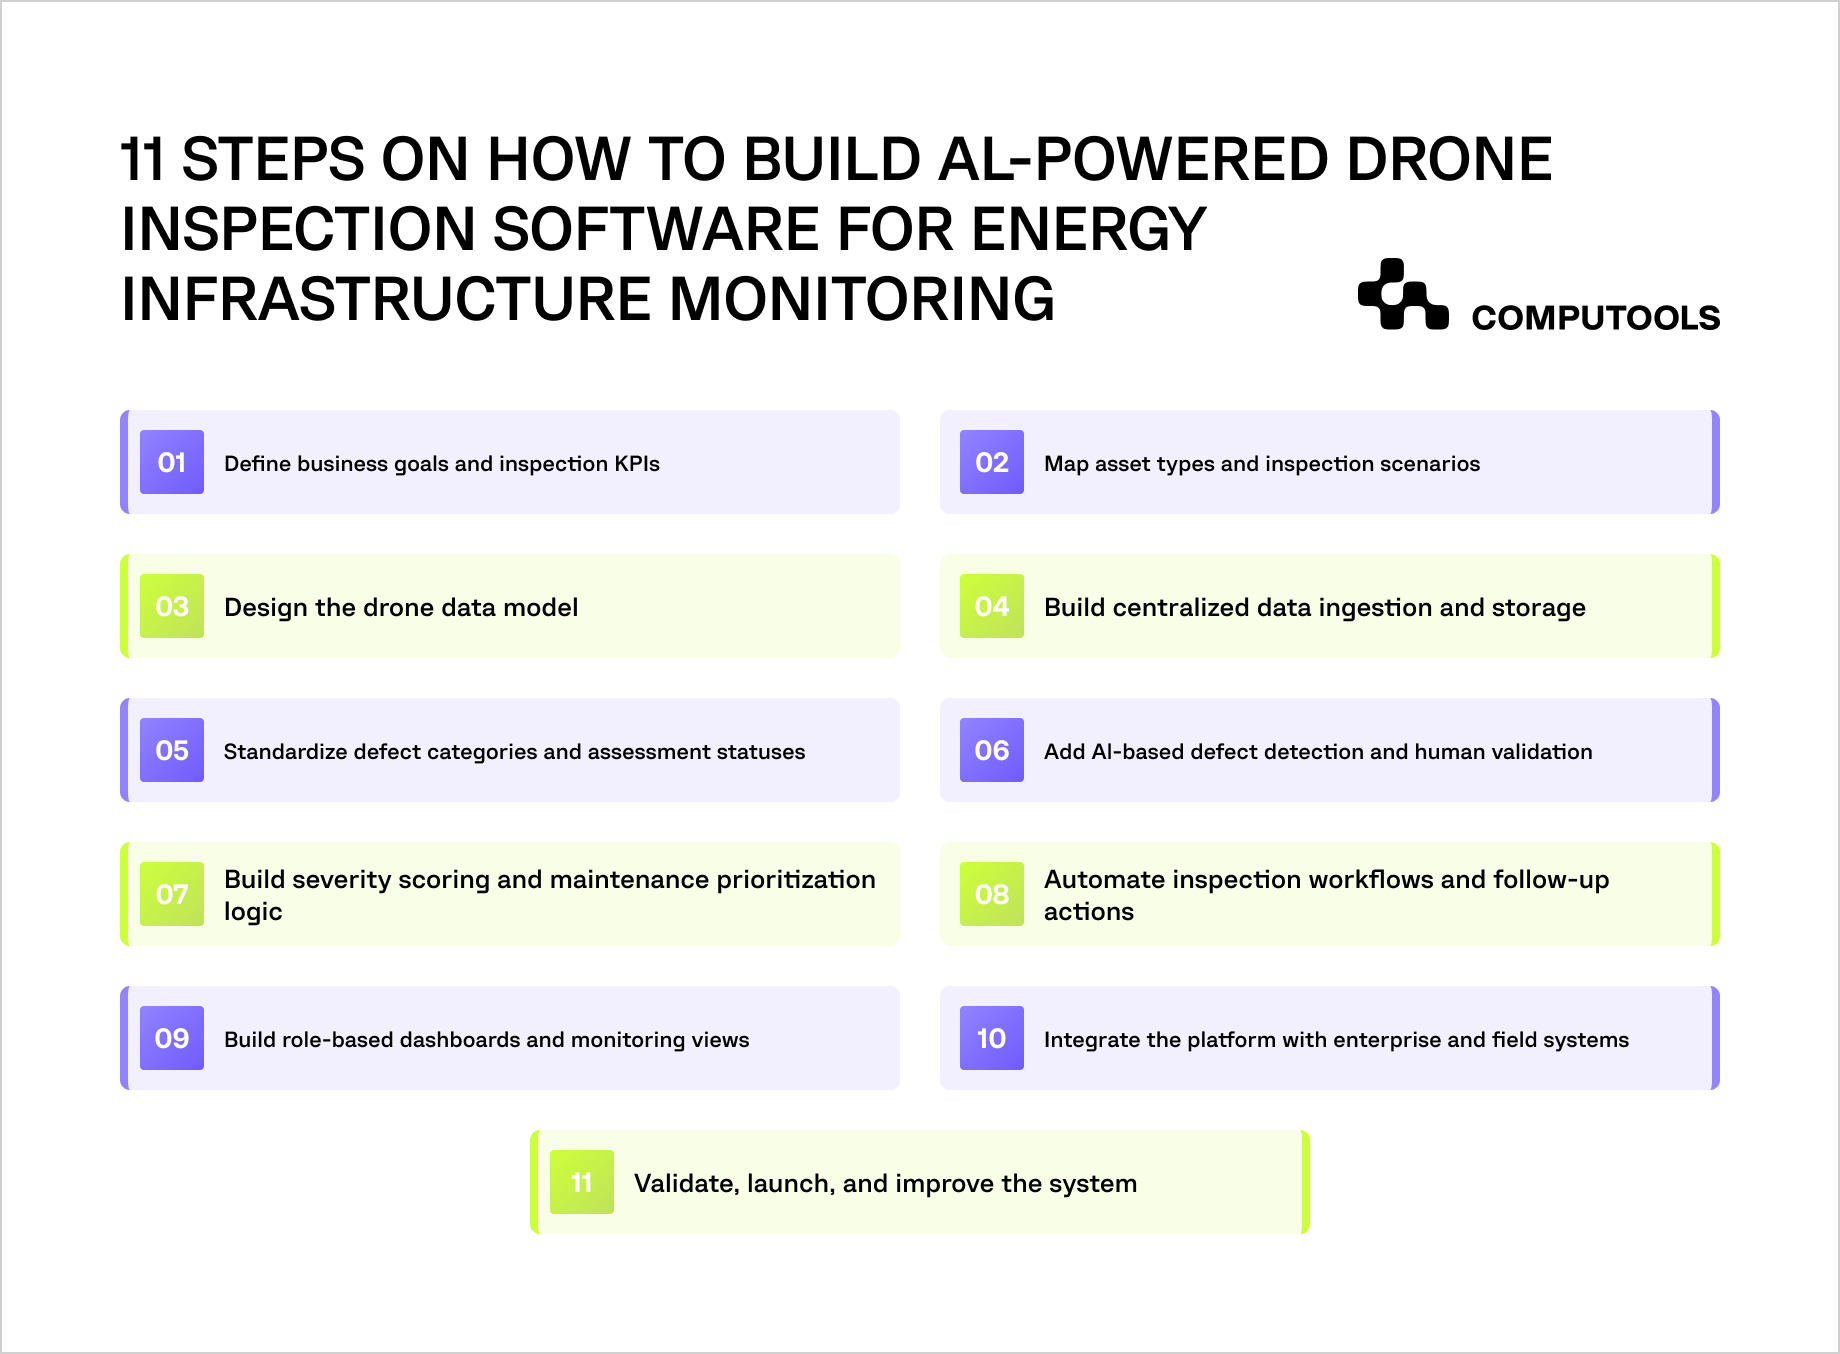
1. Define business goals and inspection KPIs
Before starting drone inspection software development, energy companies need to define which operational problem the platform should solve.
Drone inspections can support many goals: reducing manual report review, detecting defects earlier, improving asset visibility, lowering safety risks for field teams, shortening maintenance response time, or increasing uptime across distributed infrastructure. Each goal leads to different product requirements, data structures, automation rules, and integrations.
The first task is to define the asset scope. A company may need to monitor wind turbines, power lines, substations, pipelines, solar farms, offshore assets, or multiple asset types within a single system. Each asset group has its own inspection frequency, risk profile, defect categories, data formats, and maintenance workflows. Without this clarity, the platform can become a generic inspection repository that stores files but does not help teams make maintenance decisions faster.
The next task is to connect inspection goals with measurable KPIs. Useful metrics may include inspection report processing time, manual review hours, defect validation speed, number of unresolved findings, maintenance response time, repeat defect frequency, field inspection hours, asset downtime, mean time between failures, and cost per inspection cycle. These KPIs help the product team evaluate whether the software improves operational performance after launch.
This step also helps define the scope of the first rollout. Instead of covering all assets and workflows at once, the company can start with one asset type, one site, or one inspection scenario where the business value is clear. For example, a wind energy operator may begin with blade inspection reports because they affect turbine performance, repair planning, and technician safety. A utility may start with power line inspections if vegetation risks, damaged components, or thermal anomalies create frequent maintenance pressure.
For the client, this reduces execution risk. The development roadmap becomes tied to specific operational outcomes: faster inspection data processing, fewer manual checks, clearer visibility into asset condition, and better maintenance prioritization. This gives decision-makers a practical basis for budget approval, phased delivery, and ROI tracking before full-scale implementation.
2. Map asset types and inspection scenarios
An energy infrastructure monitoring software platform should reflect the physical structure of the assets it monitors. Wind turbines, power lines, substations, pipelines, solar farms, offshore platforms, and storage facilities produce different inspection data and require different maintenance decisions. Before designing the system, the team needs to define which assets, components, sites, and inspection scenarios the platform will cover.
The asset map should include a clear hierarchy. For wind turbines, this may include site, turbine, tower, nacelle, hub, blade, blade section, defect zone, and repair status. For power lines, this may include the route, towers, spans, conductors, insulators, vegetation zones, transformers, and substation equipment. This structure helps the platform connect each drone image, report, defect record, and maintenance action to the right asset.
Inspection scenarios also need to be documented. A routine inspection, emergency inspection, post-storm assessment, thermal survey, vegetation check, or follow-up repair inspection will have different data requirements. Some inspections may rely on RGB images and video, while others may require thermal imaging, LiDAR, GPS coordinates, annotated maps, or structured reports. Defining these scenarios early helps the team avoid gaps in the data model and ingestion flow.
This step also defines the defect taxonomy for each asset type. Wind turbine inspections may track blade erosion, cracks, lightning damage, coating loss, contamination, and structural damage. Power infrastructure inspections may track overheating, corrosion, broken insulators, damaged conductors, vegetation encroachment, and equipment degradation. A consistent taxonomy helps engineers compare inspection results across time and reduces confusion between field teams, contractors, and maintenance managers.
For the client, this creates traceability from inspection data to operational action. Each finding can be linked to a specific asset, component, location, severity level, and maintenance status. This improves defect validation, reduces manual investigation, and gives maintenance teams a clearer basis for prioritizing repairs across distributed infrastructure.
3. Design the drone data model
Drone inspections generate various types of data: RGB images, videos, thermal data, LiDAR scans, JSON and PDF reports, annotations, GPS coordinates, timestamps, and sensor readings. Before this data can support AI analysis or maintenance planning, it needs a shared structure that connects every file and finding to the right asset, component, location, and inspection cycle.
The data model should define how each inspection record is linked to the asset hierarchy. A finding should include asset ID, site, component, inspection date, data source, defect type, severity level, assessment status, responsible team, supporting files, repair status, and historical references. This provides engineering and maintenance teams with a consistent way to search, filter, compare, and validate inspection results across sites.
An industrial drone inspection platform also needs to distinguish between raw and processed data. Raw drone files should remain available for technical review, while extracted metadata, defect records, AI results, and maintenance statuses should be stored as structured operational data. This helps users work with inspection findings without having to open every file manually.
For AI-powered functionality, the data model should include fields for model output and human validation. The system may store detected defect type, confidence score, bounding box, or annotation, severity recommendation, reviewer decision, correction history, and final status. This creates an audit trail and helps improve model performance through validated feedback.
In the Drone Analytics project, the client had inspection reports in JSON and PDF formats, stored across different locations. Computools centralized CIR and BIR reports and created a structure that made inspection data easier to access, analyze, and use to prioritize maintenance. For energy companies, this reduces manual investigation and gives maintenance teams a reliable foundation for automation, reporting, and decision-making.
4. Build centralized data ingestion and storage
Drone inspection data should be ingested into the system through a controlled flow. The platform needs to accept inspection files from drones, sensors, contractors, and internal teams, then validate file formats, extract metadata, check asset references, identify missing fields, and detect duplicates before the data becomes available for review.
The ingestion logic should cover both structured and unstructured data. JSON reports can be parsed into predefined fields, whereas PDF reports may require extraction rules to extract inspection dates, asset IDs, blade damage categories, assessment statuses, and comments. Images, thermal files, videos, and LiDAR datasets should be linked to the same inspection record, so engineers can review the full context of each finding without searching across separate folders.
Centralized storage should separate heavy media files from operational records. Large drone files can be stored in object storage, while structured inspection data, asset metadata, defect records, user actions, and maintenance statuses can sit in a relational or specialized database. This software architecture keeps the platform scalable and makes inspection data searchable, filterable, and ready for reporting.
For energy companies, centralized storage reduces the time spent preparing inspection data before analysis. Engineers can compare inspection results across assets, sites, contractors, and inspection cycles within a single system. Maintenance teams also get a clearer view of open defects, historical findings, and repair status.
Well-structured drone software for energy companies improves operational visibility and reduces manual coordination. Instead of rebuilding inspection context from files, emails, PDFs, and spreadsheets, teams work with a structured data layer that supports AI analysis, maintenance prioritization, and faster decision-making.
In the Drone Analytics project, this issue manifested in practice: CIR reports were available in JSON, while BIR reports were delivered as PDFs. The system needed to consolidate both formats into a single storage structure, so engineers could review inspection data without searching across separate locations.
5. Standardize defect categories and assessment statuses
Inspection data becomes difficult to use when contractors, field teams, and engineers describe the same issue in different ways. One team may mark blade erosion as surface damage, another may describe it as coating loss, and a third may add it only as a comment in a PDF report. This creates inconsistent records, slows validation, and makes it harder to compare asset conditions across inspection cycles.
The platform should use a shared defect taxonomy for every asset type. For wind turbines, this may include blade erosion, cracks, lightning damage, contamination, coating loss, structural damage, and repair status. For utility asset inspection, the taxonomy may cover overheating, corrosion, broken insulators, damaged conductors, vegetation encroachment, transformer issues, and equipment degradation.
Assessment statuses should also be standardized. The system can use statuses such as new finding, under review, confirmed defect, false positive, repair required, repair scheduled, resolved, and requires follow-up inspection. These statuses help engineering and maintenance teams understand where each finding stands and who is responsible for the next action.
Severity rules should connect to the same taxonomy. A defect shouldn’t get priority solely because it appears in a report. The platform should assess defect type, asset criticality, location, inspection history, operational load, and safety risk. This helps maintenance teams decide which findings need urgent action and which can be monitored.
Standardization also improves AI performance. Computer vision models and analytics logic need consistent labels to classify defects, compare historical findings, and support maintenance prioritization. For the client, this reduces manual interpretation, improves reporting quality, and creates a cleaner data foundation for automation.
6. Add AI-based defect detection and human validation
Drone inspections can produce thousands of images and reports from a single inspection cycle. Reviewing this volume manually slows defect validation and increases the risk that critical findings are missed, duplicated, or classified inconsistently. AI helps reduce this workload by screening visual data and highlighting anomalies that need expert attention.
The platform can use computer vision for drone inspections to detect cracks, corrosion, blade erosion, surface damage, hotspots, missing components, vegetation risks, and structural deformation. The exact model logic depends on the asset type, available data quality, inspection angles, image resolution, and defect taxonomy defined in the previous step.
AI results should be connected to a validation workflow. Engineers need tools to confirm, reject, edit, or reclassify detected findings before they affect maintenance planning. The system should store the original AI output, the reviewer’s decision, the correction history, the final defect status, and supporting files. This creates an audit trail and gives teams more control over safety-critical decisions.
Human validation also improves the software over time. Confirmed defects, rejected detections, and corrected labels create feedback for model tuning and better prioritization logic. For the client, this means AI does not replace engineering review. It reduces manual screening and helps experts focus on findings with higher operational risk.
The business effect is faster defect review and cleaner maintenance input. Instead of spending time opening every file, engineers can work from pre-screened findings, validate the most relevant defects, and send confirmed issues into the next maintenance workflow faster.
7. Build severity scoring and maintenance prioritization logic
Detected defects need a clear priority structure before they can support maintenance planning. A crack, hotspot, erosion mark, or damaged component can have a different operational impact depending on asset criticality, defect location, previous inspection history, workload, safety risk, and repair accessibility. The platform should evaluate these factors before sending findings into maintenance workflows.
The scoring model should combine technical and operational rules. Technical inputs may include defect type, size, confidence level, visual evidence, thermal anomaly level, and recurrence. Operational inputs may include asset importance, current performance, downtime risk, maintenance window availability, crew location, spare parts availability, and SLA requirements.
This logic supports predictive maintenance with drones by helping teams move from isolated inspection findings to risk-based planning. If the system shows that a defect is recurring, growing, or located on a critical asset, maintenance teams can act earlier and reduce the chance of unplanned downtime. Lower-risk findings can stay under monitoring without consuming urgent repair resources.
The platform should also make prioritization transparent. Engineers and maintenance managers need to see why a finding received a specific severity level: defect category, asset criticality, inspection history, and business rule used by the system. This reduces disputes between teams and helps managers justify repair decisions.
In the Drone Analytics project, Computools implemented a business logic module to prioritize maintenance tasks. The delivered system enabled the client to use inspection reports as operational input rather than static documentation. For energy companies, this step improves resource planning, reduces manual defect sorting, and gives teams a clearer order of action across large asset fleets.
Drone inspection data can also support broader energy performance goals. When defect records, asset condition, and maintenance priorities are connected with real-time monitoring and analytics, energy companies can identify operational inefficiencies earlier and plan corrective actions with better context. Computools explains this approach in a related guide on how to build an energy optimization system for sustainable operations.
8. Automate inspection workflows and follow-up actions
After defects are validated and prioritized, the platform needs to move findings into a clear operational workflow. Each confirmed issue should have an assigned status, responsible team, deadline, severity level, supporting files, and next action. Without this workflow layer, inspection results still depend on manual handover between engineers, maintenance managers, contractors, and field teams.
Infrastructure inspection process automation should cover the full path from defect confirmation to repair tracking. The system can create maintenance tasks, update asset history, send alerts, generate reports, attach source images, assign work to the appropriate team, and track whether an issue is under review, scheduled, resolved, or awaiting follow-up inspection.
Workflow logic should also reflect approval requirements. A high-severity defect may need engineering validation before it becomes a repair task. A lower-priority finding may be added to the next planned maintenance cycle. A recurring defect may need escalation if it appears across several inspection rounds. These rules reduce inconsistent decision-making and help teams act faster without losing control over safety-critical findings.
The platform should keep every action traceable. Users need to see who validated the defect, who changed its status, which files support the decision, when the repair was scheduled, and whether the asset was reinspected after maintenance. This helps energy companies improve accountability across internal teams and external contractors.
For the client, workflow automation reduces the delay between inspection and response. Maintenance teams spend less time copying findings between reports, emails, spreadsheets, and work order tools. Engineering teams get cleaner handover, managers get better visibility into unresolved risks, and field teams receive clearer repair priorities.
The delivered Drone Analytics system used automated report extraction and business rules to reduce the gap between inspection review and maintenance planning. This helped the client move from manual report handling to a more controlled process for turning inspection findings into prioritized maintenance actions.
9. Build role-based dashboards and monitoring views
Inspection data should be presented according to how each team uses it. Engineers need access to defect details, source images, annotations, AI recommendations, severity scores, validation history, and repair status. Maintenance managers need open tasks, overdue findings, asset priority, workload distribution, and upcoming repair windows. Operations leaders need fleet-level risk, recurring defects, downtime exposure, and maintenance performance trends.
The dashboard should support decision-making, not show all metrics. Users should filter assets by severity, location, date, defect, repair status, contractor, and cycle to identify urgent findings, follow-up needs, and risk hotspots.
A monitoring dashboard can show turbines, substations, power lines, pipelines, or solar assets by location, condition status, and open maintenance issues. This gives managers a clearer view of asset health across sites and helps field teams plan routes, inspections, and repairs with less manual coordination.
Dashboards should also include historical comparison. Engineers need to see whether a defect is new, recurring, expanding, or already repaired. Maintenance teams need to compare current inspection results with those from previous cycles to determine whether the asset’s condition is improving or worsening. This supports better repair prioritization and reduces the need for repeated manual checks.
For the client, role-based dashboards improve visibility and shorten the path from data review to action. Instead of requesting updates from different teams or searching through separate reports, users work from one operational view that connects inspection findings, asset condition, maintenance status, and risk level.
10. Integrate the platform with enterprise and field systems
Drone inspection findings become operationally useful when integrated into the systems that already manage maintenance, asset management, and fieldwork. The platform should connect with CMMS, EAM, ERP, GIS, SCADA, IoT platforms, contractor portals, and document management tools, depending on the company’s existing infrastructure.
Integration requirements should be defined around the data that needs to move between systems. A confirmed defect may need to become a work order in CMMS. Asset location and route data may need to sync with GIS. Equipment condition and sensor readings may need to be connected to IoT or SCADA systems. Repair costs, spare parts, and crew planning may need to connect with ERP or maintenance planning tools.
The data model has to match these integration points. If a validated finding is transferred into a maintenance system, the inspection platform should provide asset ID, defect type, severity level, location, supporting files, inspection date, responsible team, and current status. Missing or inconsistent fields can break the workflow and force teams back into manual data entry.
For AI drone inspection solutions, integrations also help connect AI output with business action. A detected and validated defect can trigger a maintenance task, update asset history, notify the right team, and support reporting without requiring engineers to copy findings between systems. This reduces handover delays and lowers the risk of unresolved defects staying in static reports.
For the client, this step protects the platform’s value after launch. Inspection data becomes part of the operating process, not a separate tool that creates more administrative work. Maintenance teams can act on confirmed findings faster, managers get clearer visibility into open risks, and asset records stay consistent across inspection, repair, and reporting workflows.
For companies that want to connect drone inspection results with broader operational visibility, Computools also explains how to develop a real-time energy asset monitoring platform that processes IoT data, tracks asset condition, and supports faster response to equipment risks.
11. Validate, launch, and improve the system
Before full rollout, the platform should be tested with a limited set of assets, sites, or inspection scenarios. This helps the team validate data quality, ingestion rules, AI output, workflow logic, dashboard usability, and integration stability before the system is scaled across more assets or regions.
Validation should cover both technical and operational criteria. The team needs to check whether inspection files are linked to the correct assets, whether defect categories are consistent, whether AI findings can be reviewed and corrected, whether severity scores match maintenance rules, and whether confirmed defects move correctly into follow-up workflows. These checks reduce the risk of launching a system that looks complete but creates extra work for engineers and maintenance teams.
The first rollout should be tied to the KPIs defined at the beginning of the project. Relevant metrics may include manual review time, defect validation speed, unresolved finding volume, maintenance response time, field inspection hours, repeated defects, downtime exposure, and mean time between failures. Tracking these indicators helps decision-makers understand whether the platform is improving inspection and maintenance performance.
AI-based asset monitoring solutions also need a feedback loop after launch. Confirmed defects, rejected AI findings, corrected labels, repair outcomes, and recurring issue patterns should be used to refine models, severity rules, and prioritization logic. This helps the system become more accurate and more useful as inspection history grows.
For the client, phased rollout and continuous improvement reduce execution risk. The company can validate business value within a controlled scope, adjust the product before scaling, and link further investment to measurable operational outcomes: faster inspection review, clearer asset visibility, better maintenance planning, and lower risk across energy infrastructure.
In Drone Analytics, the cooperation started with a pilot that helped validate Computools’ fit with the client’s requirements before full-scale implementation. This approach reduced delivery risk and provided the client with a clearer basis for expanding the system once the first operational value was proven.
Launch your AI-powered drone inspection software within 1–3 months instead of years. Transform inspections into a scalable source of operational intelligence across your energy assets.
How AI drone inspection software turns inspection data into maintenance decisions
Drone inspection software creates business value when inspection findings move through a clear decision path: data capture, validation, risk scoring, maintenance prioritization, and follow-up tracking. Energy companies need this structure because drone inspections generate large volumes of images, reports, sensor data, and annotations, while maintenance teams still need to understand which findings require action first.
1. The first layer is data confidence
Each finding needs to show its source file, asset location, inspection date, AI result, reviewer status, and supporting evidence. This helps engineers determine whether a defect is confirmed, still under review, duplicated, or a false positive. Clear validation logic reduces the risk of sending weak findings into maintenance planning.
2. The next layer is operational risk
A defect should be assessed against asset criticality, location, defect type, inspection history, and maintenance urgency. This is especially important for drone monitoring systems for utilities, where teams may need to compare findings across turbines, substations, transmission lines, and distributed grid assets. A minor defect on a critical turbine blade, power line segment, or remote asset can require faster action than a similar issue on lower-risk infrastructure.
3. The final layer is execution
Confirmed findings should be addressed as maintenance tasks, repair recommendations, follow-up inspections, or items for monitoring. In power line inspection software, this may mean turning vegetation risks, damaged conductors, broken insulators, or thermal anomalies into assigned maintenance actions with clear owners, deadlines, supporting files, and follow-up inspection status.
In the Drone Analytics project, Computools applied this logic through centralized storage of CIR and BIR reports, automated extraction of inspection data, and a business logic module for maintenance prioritization. The system helped the client reduce manual analysis and use inspection reports as input for turbine maintenance planning. For energy companies, this decision model turns drone inspections into a measurable asset performance process.
Why Computools is the right partner for energy inspection software
Computools helps energy companies turn fragmented inspection data into operational systems that support faster maintenance decisions, better asset visibility, and lower field risk. In the Drone Analytics project, the team developed a centralized web system to manage CIR and BIR reports, automated inspection data extraction, and added business logic for maintenance prioritization. The solution helped the client increase MTBF (mean time between failures) by 5%, reduce operational costs and time, involve fewer personnel, and improve safety by minimizing high-altitude tasks.
1. Energy and utility domain expertise
Computools develops software for energy companies that need asset monitoring, predictive AI analytics, operational visibility, and maintenance automation. This matters for companies planning to build drone inspection software because inspection data has to support real decisions across engineering, field operations, and asset management teams.
2. Electric power infrastructure experience
Through electric power software development, Computools supports smart grid management, outage tracking, energy analytics, SCADA and remote monitoring, asset infrastructure management, and renewable energy integration. This experience helps connect drone inspection findings with grid assets, field operations, outage prevention, and maintenance workflows.
3. Oil and gas inspection relevance
Computools also provides oil and gas software development for companies managing pipelines, production sites, tanks, offshore assets, and remote field equipment. The same inspection logic can help these teams turn drone data into verified findings, repair priorities, and maintenance actions.
4. Field-ready product delivery
Drone inspection platforms often need mobile access for technicians, engineers, and field managers. Computools’ mobile app development services can support field workflows where users review findings, update task statuses, access asset data, and work with inspection records outside the office.
5. Lower execution risk through phased delivery
Computools can start with a pilot, validate the data flow, test the AI workflow, define KPIs, and expand the platform after the first operational scenario proves value. This helps energy companies avoid a large, uncontrolled rollout and link further development to a clear ROI roadmap.
6. Measured delivery capacity
Computools’ electric power expertise is supported by 250+ experts, 20+ delivered projects, 2x faster field operations, and a 65% reduction in equipment downtime. For drone inspection projects, this matters because the platform must integrate inspection data architecture, AI automation, integrations, UX, and long-term technical support into a single operating system.
If you are planning to build an AI-powered drone inspection platform for energy infrastructure, contact Computools at info@computools.com to discuss your asset scope, inspection data, and maintenance goals.
If your team is comparing vendors before starting a project, Computools’ overview of top energy software development companies explains what to look for in partners that build software for utilities, renewable energy providers, and oil and gas businesses.
Conclusion
AI-powered drone inspection software helps energy companies turn drone images, reports, and sensor data into structured maintenance intelligence. It accelerates defect validation, improves asset visibility, supports risk-based prioritization, and connects inspection findings to repair planning.
Computools’ Drone Analytics case shows this in practice: the system centralized CIR and BIR reports, automated data extraction, and added business rules for maintenance prioritization. For similar projects, phased delivery, clear KPIs, and a roadmap to ROI help reduce execution risk and keep the platform focused on measurable operational value.
Computools
Software Solutions
Computools is an IT consulting and software development company that delivers innovative solutions to help businesses unlock tomorrow.


