Our client, a finance and data startup, needed to extend their mobile stock price monitoring application to the Android platform. Our Computools team provided CTO as a Service by developing an Android application version using React Native and MPAndroidChart. As a result, the application became available to Android users. We added registration/login functions, real-time stock price display, charts, price indicators, detailed stock information, filters, and tracked stock lists.
The client is a start-up in the United States that specialises in the financial exchanges and data sector, with a focus on artificial intelligence and robotics.
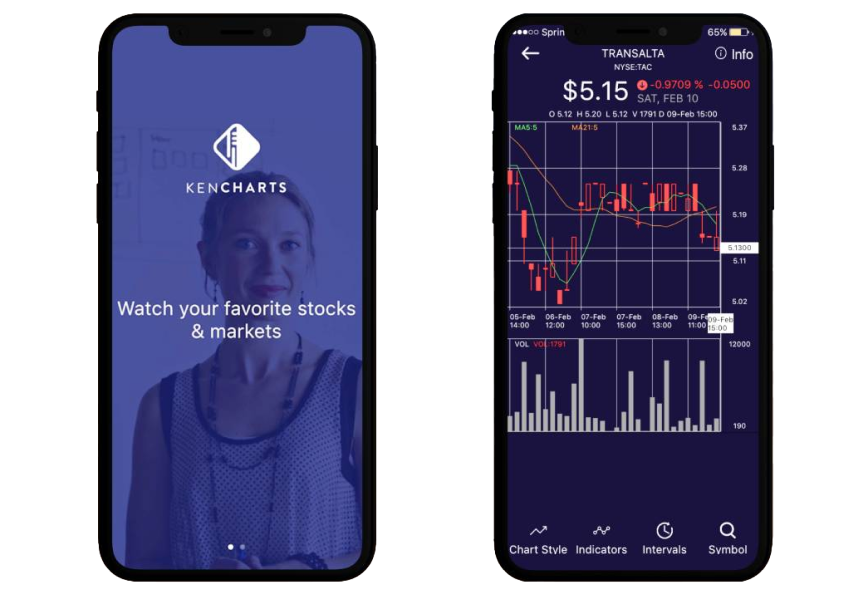
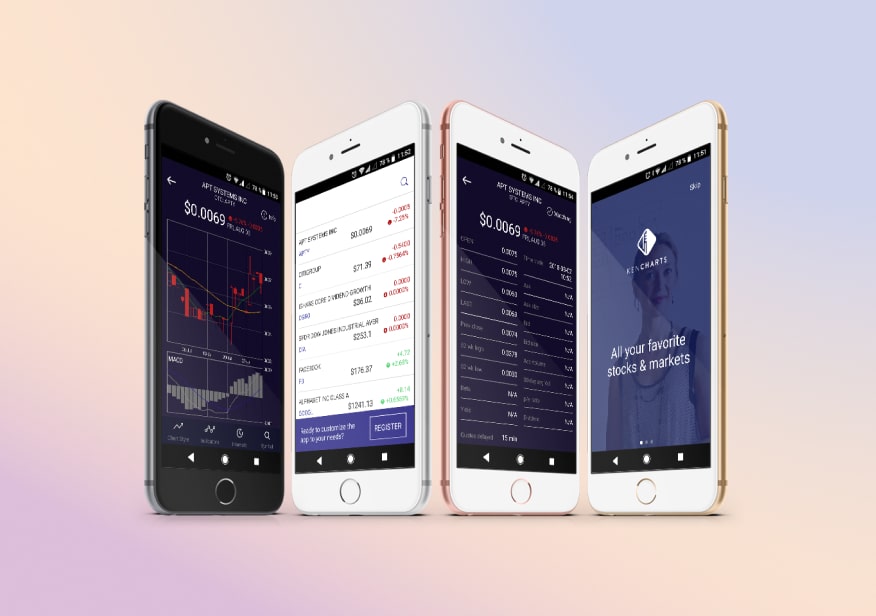
It provides a mobile application for monitoring North American equities, making it easier for traders and investors to access real-time market data. The app offers various chart types, technical indicators and detailed information on stock prices and market dynamics. It is available on both iOS and Android platforms, catering to a wide user base in the financial industry.
As a start-up in the financial sector, the client aims to provide innovative trading research tools and platform solutions for fund management, contributing to the dynamic landscape of stock and share trading in North America.
There was an existing iOS app for monitoring North American equities, and the team wanted to create an equivalent Android version. The challenges included improving libraries for app development.
To address the problem, the Computools team offered a CTO, who developed a roadmap for the solution. Our team used React Native for Android app development, allowing code reuse and faster development. They integrated the MPAndroidChart library for graphical displays, offering various chart types and high customisation.
The app’s features and functionalities included sign-up/sign-in via email, password restore, real-time display of current share prices, various chart types (candlestick and bar graphs), price indicators (RSI, MACD, Bollinger, Stochastic, etc.), details of shares with trend parameters, filters by price range or stock market, and the ability to create a list of tracked shares.
Computools’ CTO used optimal solutions to achieve their goals and made several improvements that made the application even more effective for the client.
Developing an Android version allowed the app to expand its user base to the Android platform. The project included enhancements to the application’s interface, making it more user-friendly and visually appealing. It also involved correcting the logic of price indicators, ensuring that the app provided accurate and reliable information for traders and investors.
Computools CTO as a Service was chosen due to expertise, effective communication, agile methodologies, innovation and commitment to delivering high-quality solutions on time.
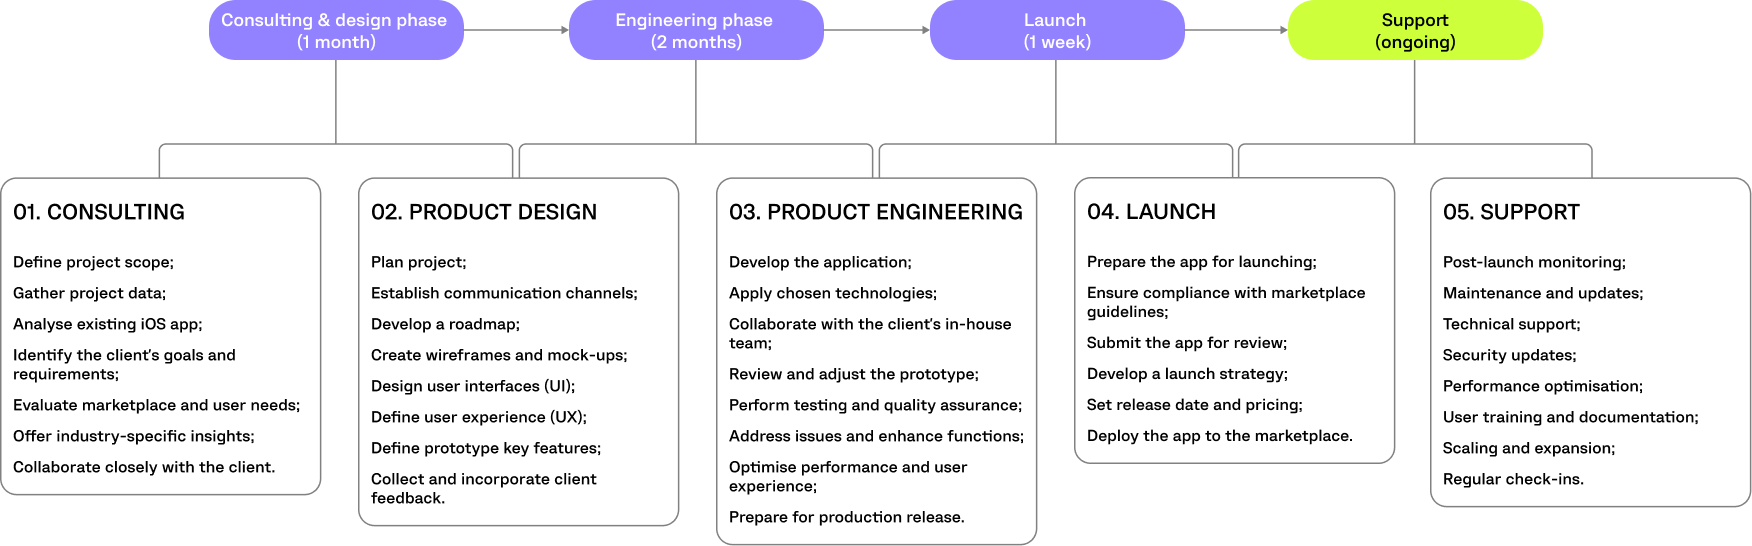
Design plays an important role in creating a satisfying user experience and a successful marketing strategy for a mobile app.
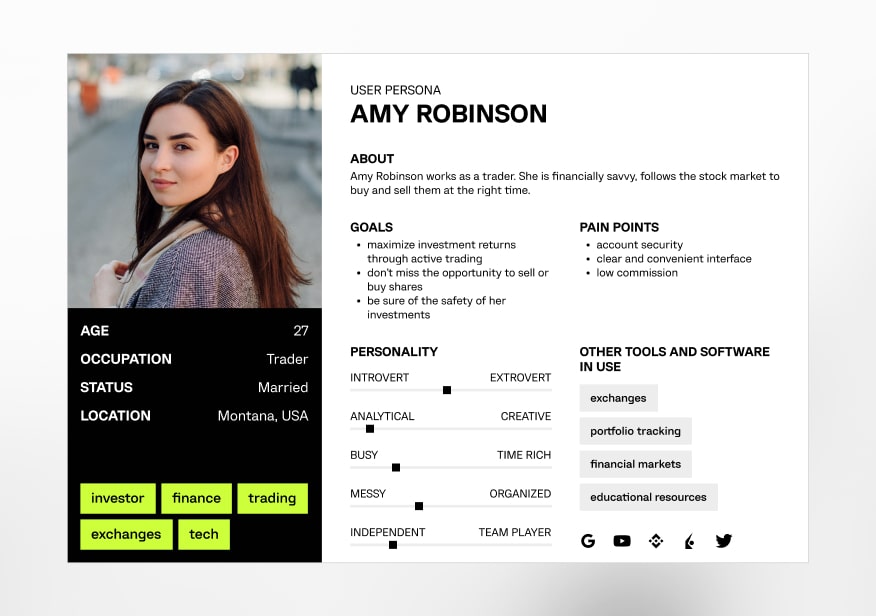
A detailed profile of the target user, including their characteristics, behaviours and goals, to guide software engineering and marketing strategies.
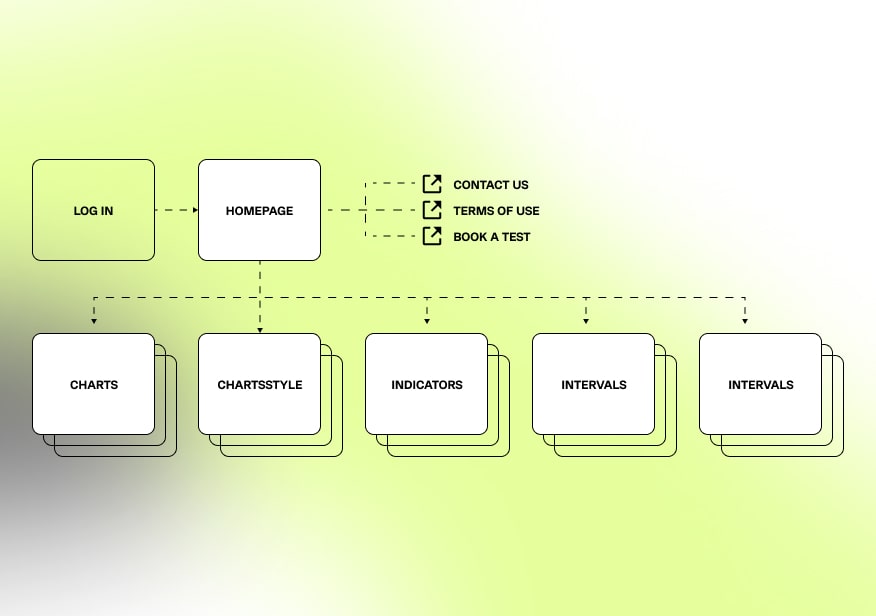
An organised and hierarchical structure that outlines the website's pages and their relationships, serving as a blueprint for navigation and content.
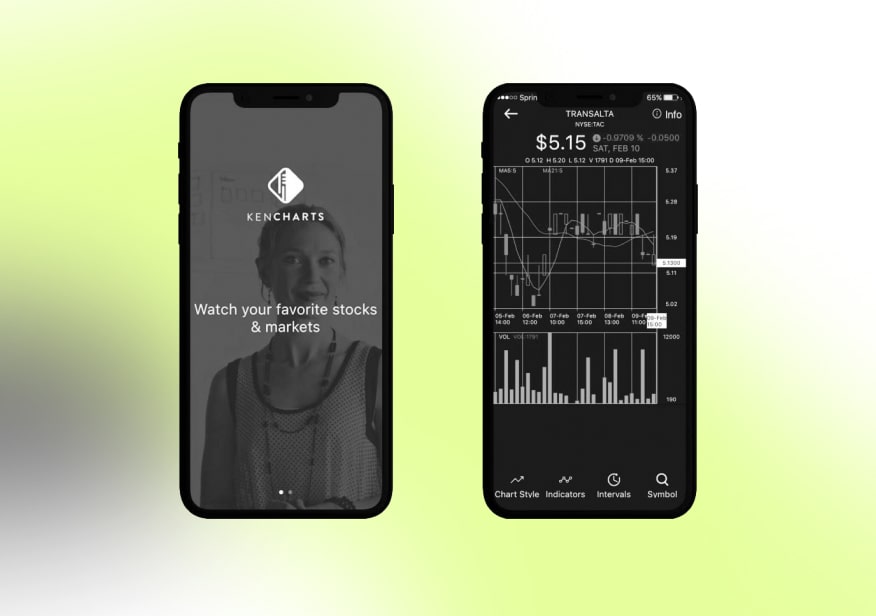
Visual representations of webpage layouts, showing the basic structure and placement of elements without detailed design, aiding in the planning and communication of website design.
The visual and interactive elements of a website or application that users interact with and that influence the user experience, including menus, buttons, forms, and the overall design.

Redux
Redux was employed as the state management library, ensuring consistent behaviour, cross-platform compatibility, and ease of testing. It provided functionality for managing the application's state and was integral to the Android app's development.
React Native
React Native was chosen as the primary technology for developing the Android version. It enabled the development of a cross-platform application, allowing for code reusability between Android and iOS versions. React Native is known for its efficiency in creating visually appealing and responsive mobile applications.

MPAndroidChart
MPAndroidChart library was used for graphical display within the application. This powerful Android chart view/graph view library supports various chart types, including line, bar, pie, radar, bubble and candlestick charts. It also provided functionality for scaling, dragging and animations, making it suitable for visualising financial data. The project team even extended the library to include additional chart types.
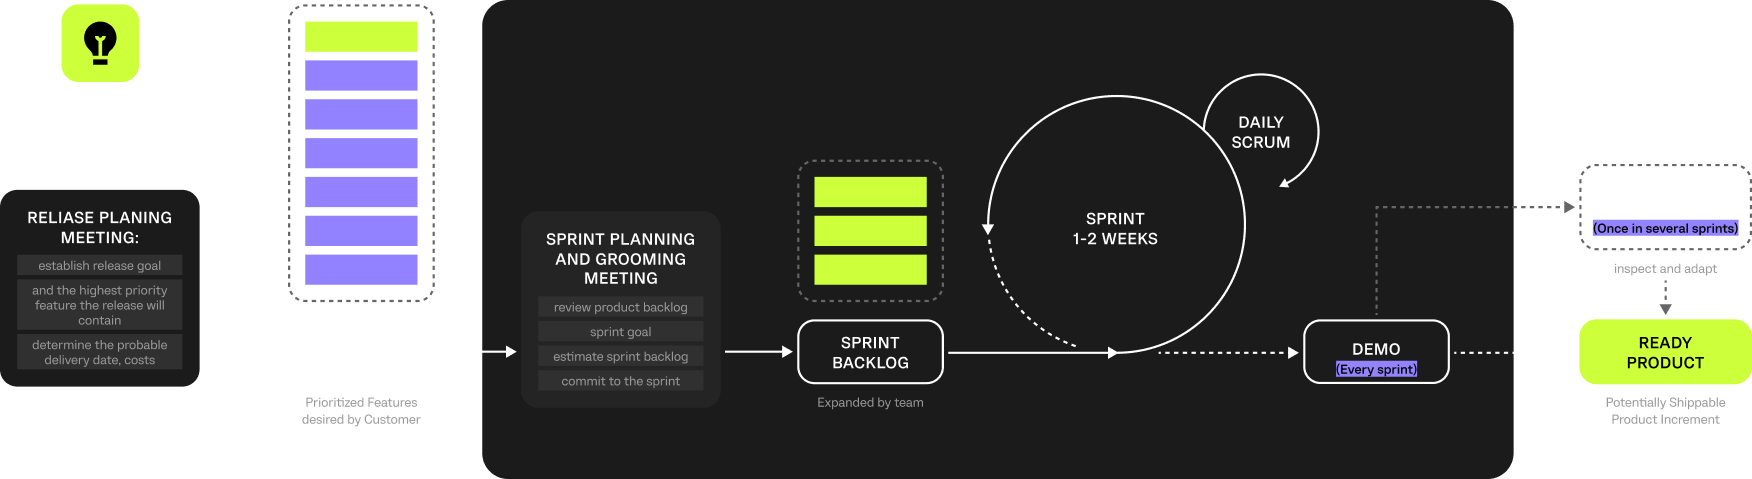
The project management approach included a combination of Scrum and Kanban. Scrum was used for dividing complex tasks into smaller, manageable parts and visualising the workflow, while Kanban was employed to ensure continuous development and delivery. This combination allowed the team to work on both long-term tasks and issues that arose during development, making the process more efficient.
The careful selection and utilisation of these digital platforms and technologies played a crucial role in successfully developing Android applications. They contributed to creating a user-friendly, feature-rich application for monitoring North American equities and aligning with the client’s objectives in the financial exchanges and data sector.
Working with Computools was a game-changer for our company. Their expertise and dedication helped us develop cutting-edge solutions that transformed our business. We highly recommend their services.

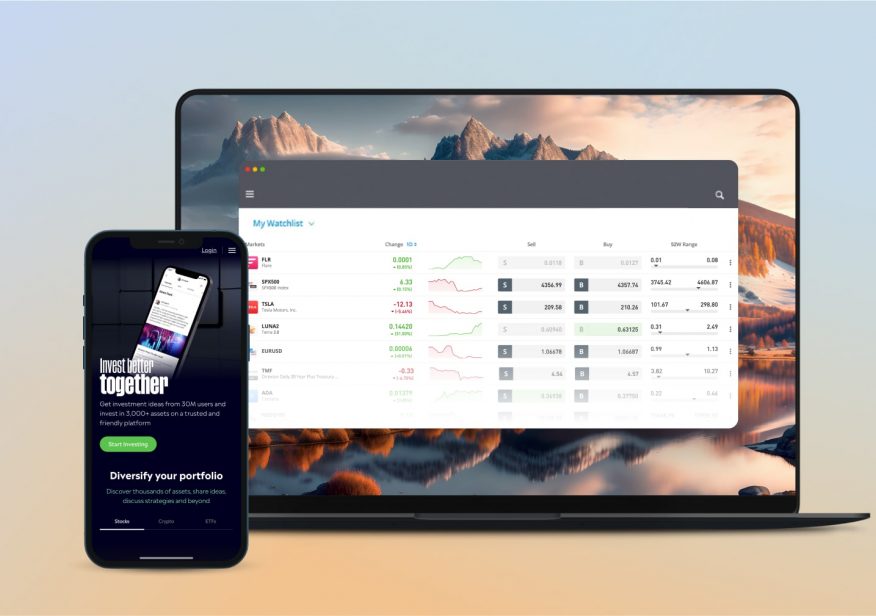
Our client, a global leader in social trading, invited us to develop an MVP for a cryptocurrency exchange platform. The collaboration resulted in the engineering of four demo projects. Our team implemented, among others, the "Follow the Trader" feature, which allows users to track and copy the trading strategies of experienced traders. Ultimately, we helped the client build an efficient mechanism for exchanging cryptocurrencies without intermediaries, where users can directly convert cryptocurrencies, ensuring maximum speed and security.

The client struggled with complex and inefficient security systems. Our team has developed a customised solution that can handle energy devices, use the latest algorithms to predict various events and make intelligent decisions in different situations. This system is also able to predict how devices can be better placed and configured to work more efficiently in terms of improved sustainability, performance and security.


Our client, a Multitrading startup, offers various types of entertainment, including sporting events, concerts and theatre performances. The client faced performance and usability issues with their existing ticket booking website, and our team proposed a system modernisation. We developed a multi-threaded web application capable of handling millions of simultaneous requests. Our team’s solution improved user experience, reduced waiting time and increased revenue for the client.

Computools | 341 Raven Cir, Camden Wyoming, Delaware 19934, US


